- USD/CAD is off the multi-month lows as the market is near 1.3100.
- Resistances to the upside are seen at 1.3123 and 1.3170.
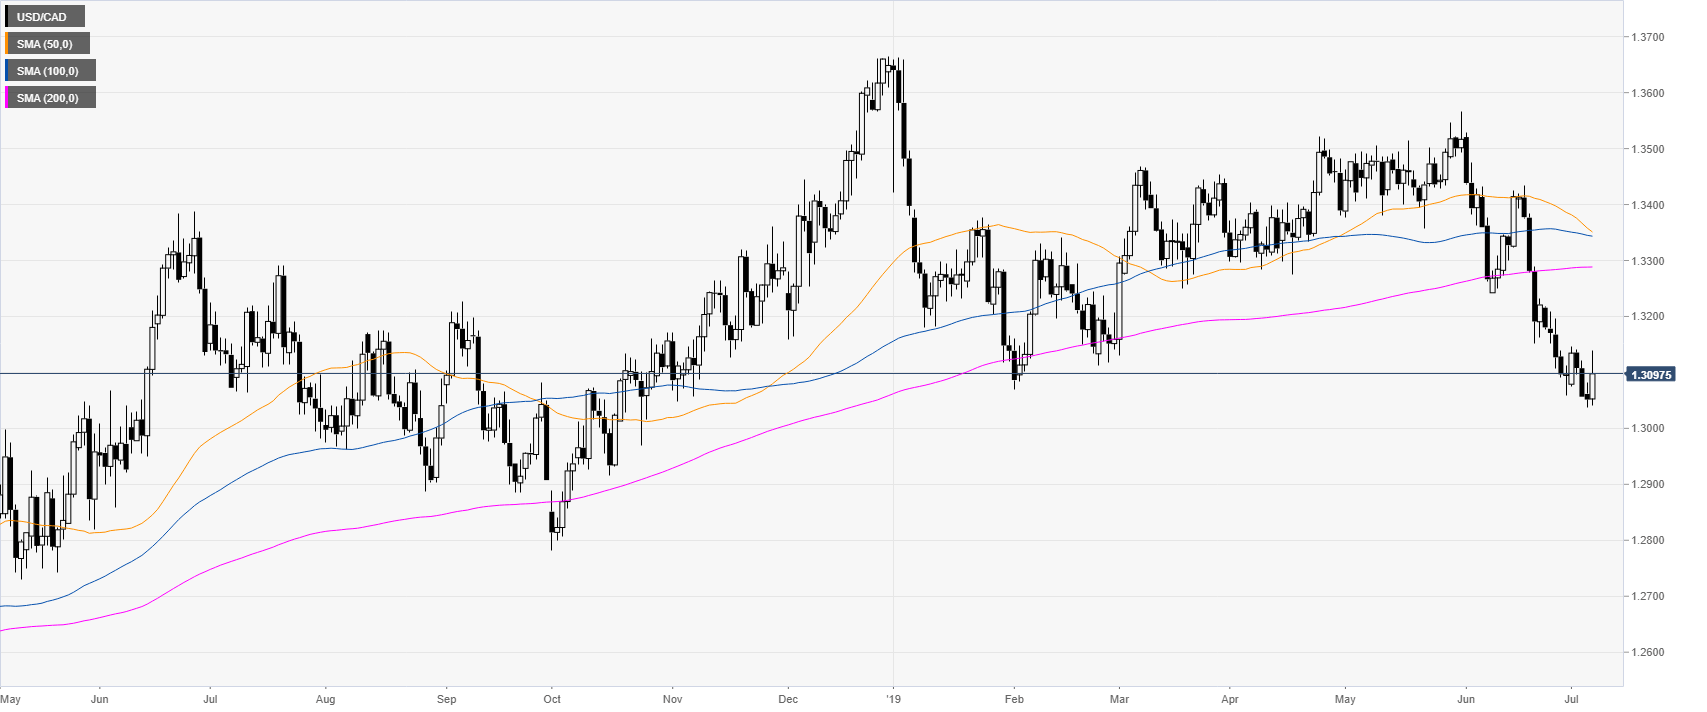
USD/CAD daily chart
USD/CAD is hovering near multi-month lows as the market is trading below its main daily simple moving averages (DSMAs).
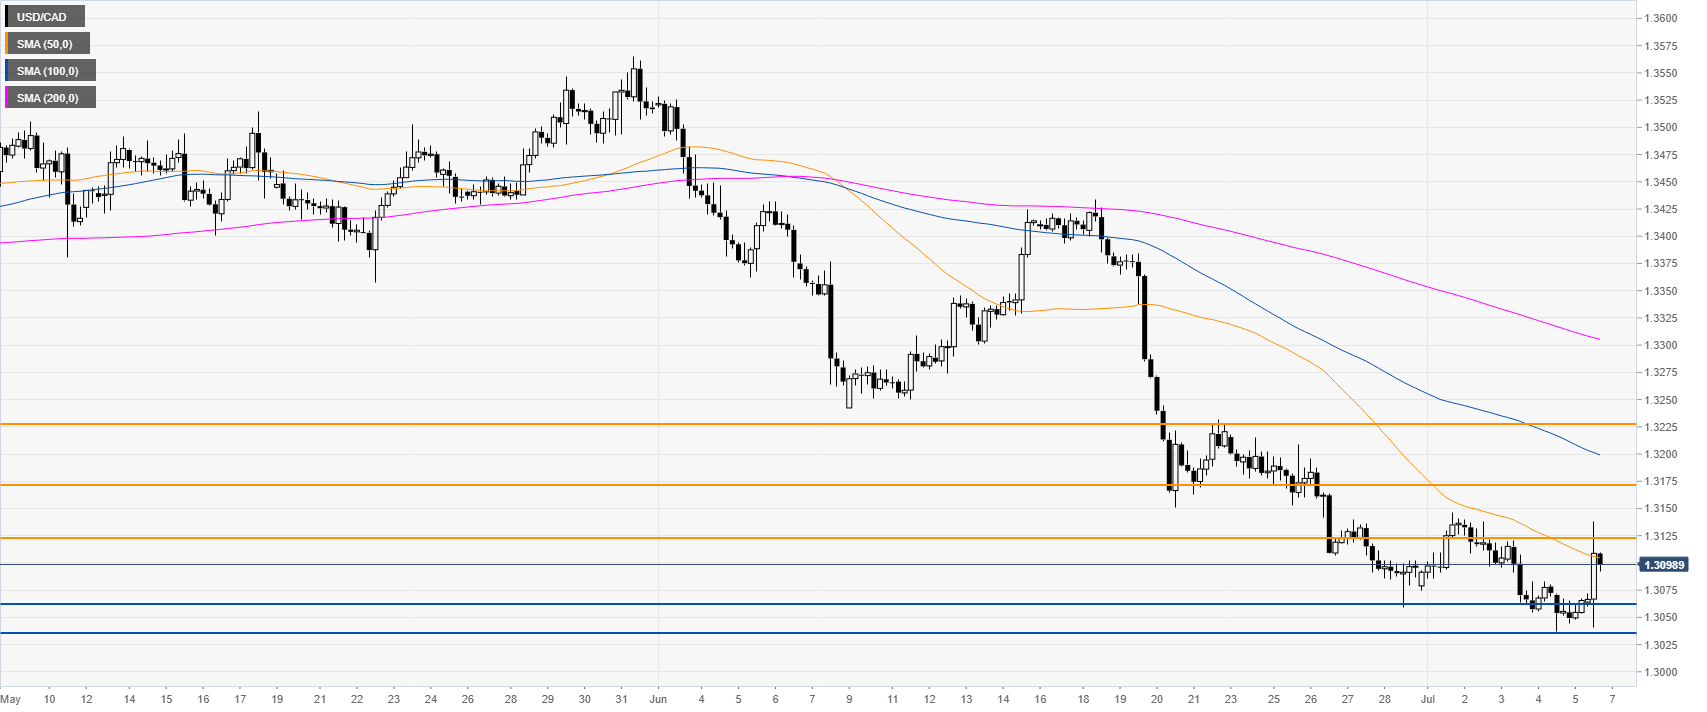
USD/CAD 4-hour chart
USD/CAD leaped above the 1.3100 figure on the stellar US Nonfarm Payrolls. The market is now hovering around this level and the 50 SMA. The level to beat for bears is 1.3060 and 1.3055.
USD/CAD 30-minute chart
The market is trading near 1.3100 while above its main SMAs. Bulls would ideally need a close above 1.3123 to reach 1.3170, according to the Technical Confluences Indicator.
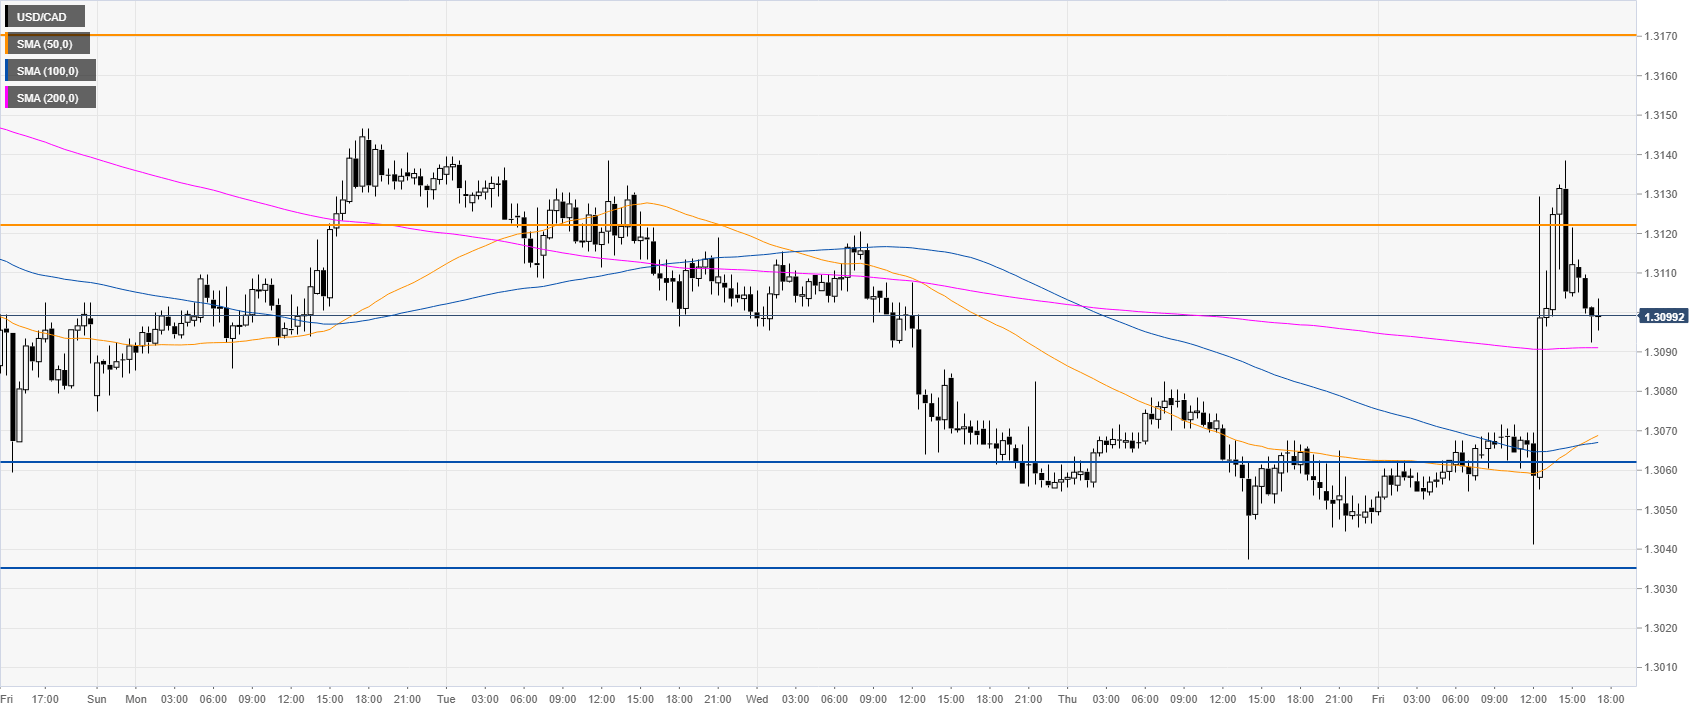
Additional key levels
