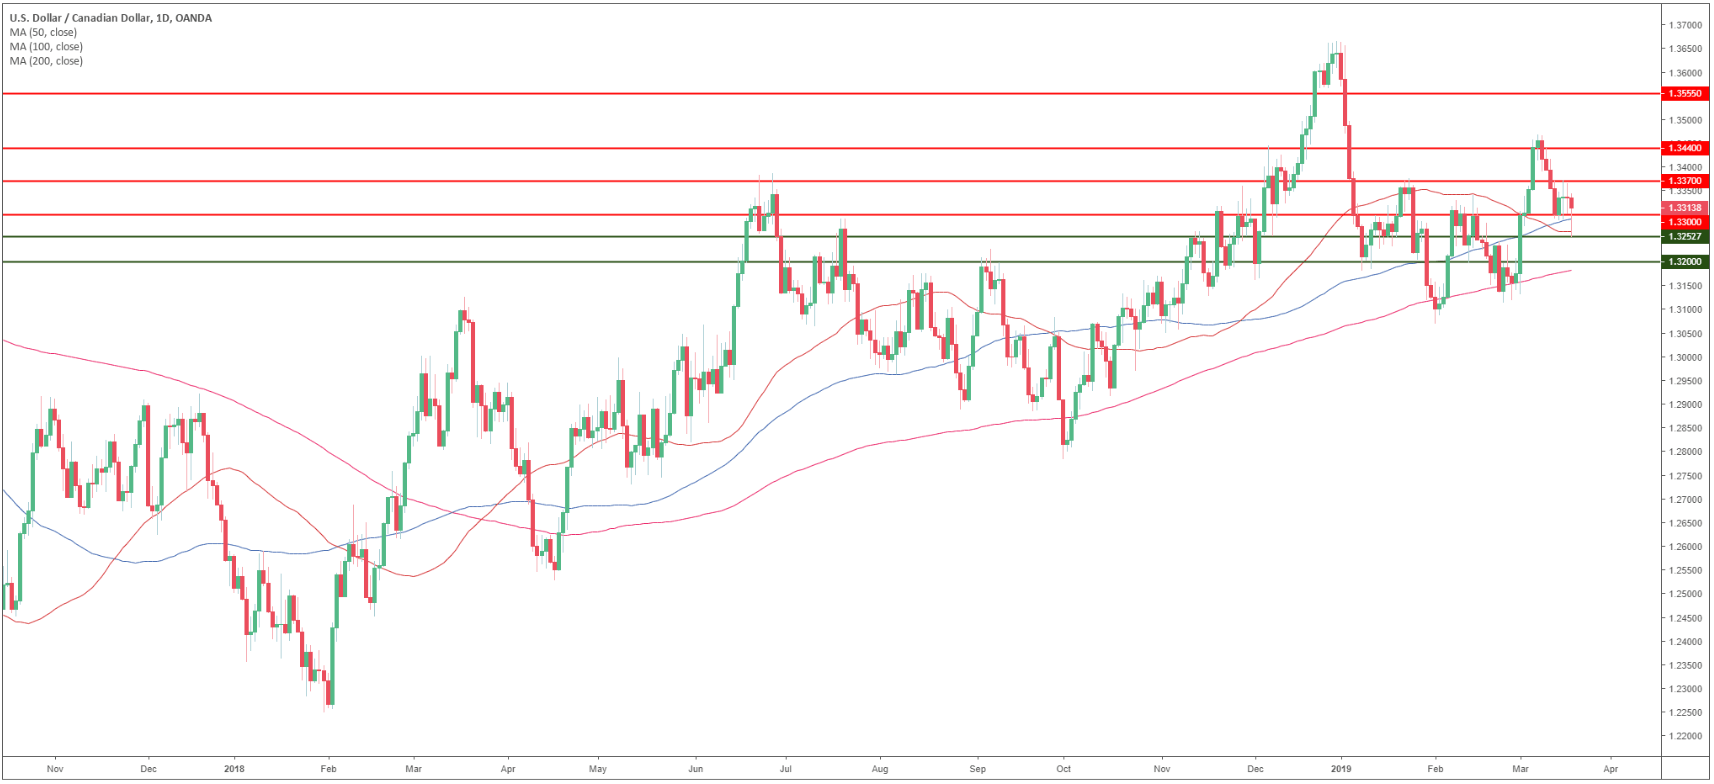
USD/CAD daily chart
- USD/CAD is trading in a bull trend above the 200-day simple moving averages (SMA).
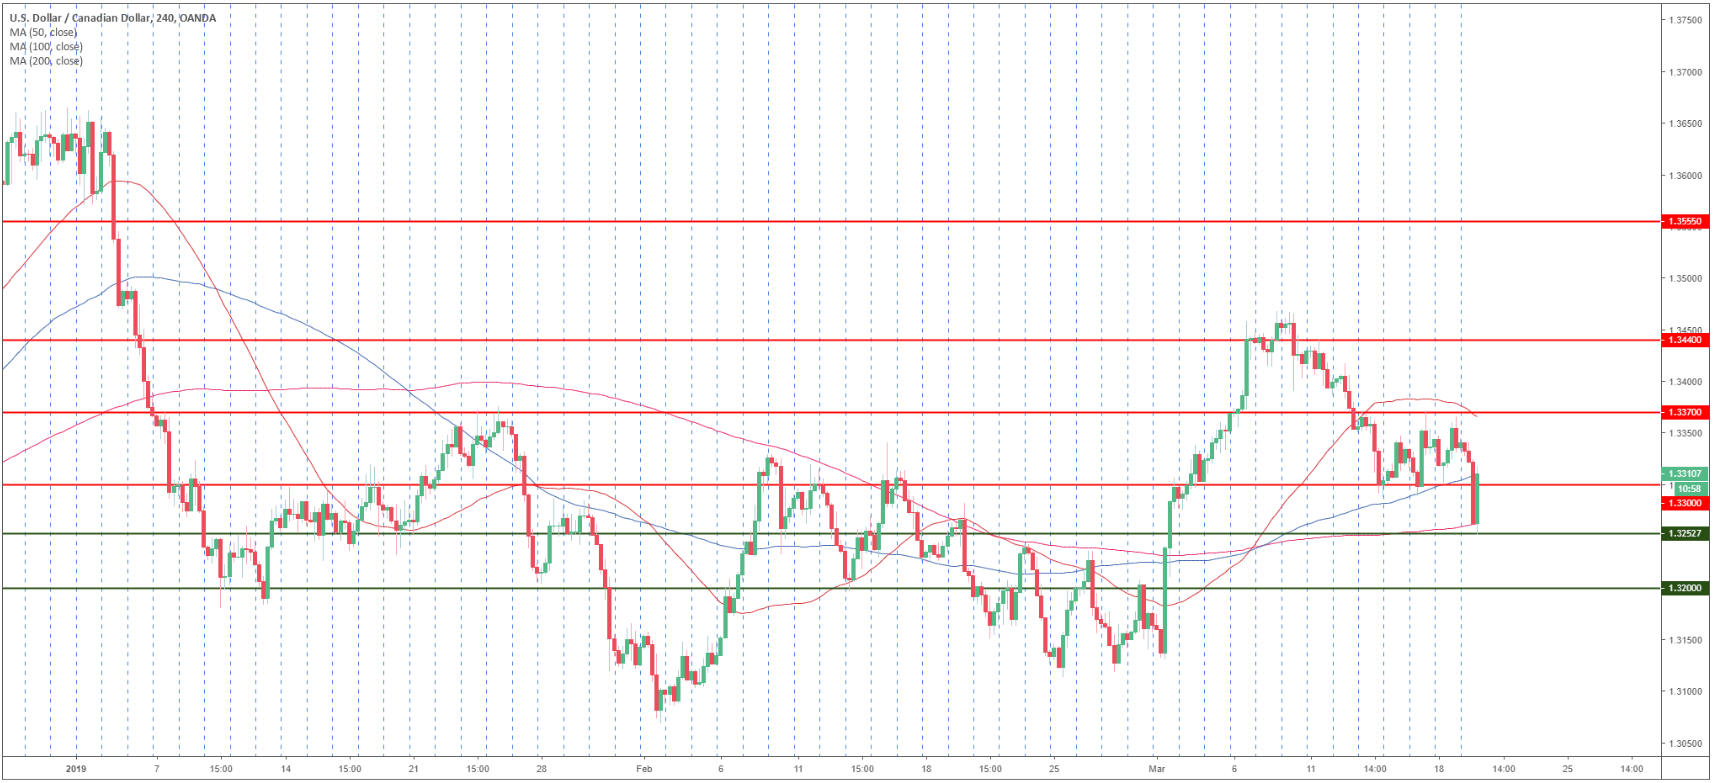
USD/CAD 4-hour chart
- USD/CAD is trading between the 100 and 200 SMAs suggesting a consolidation in the medium-term.
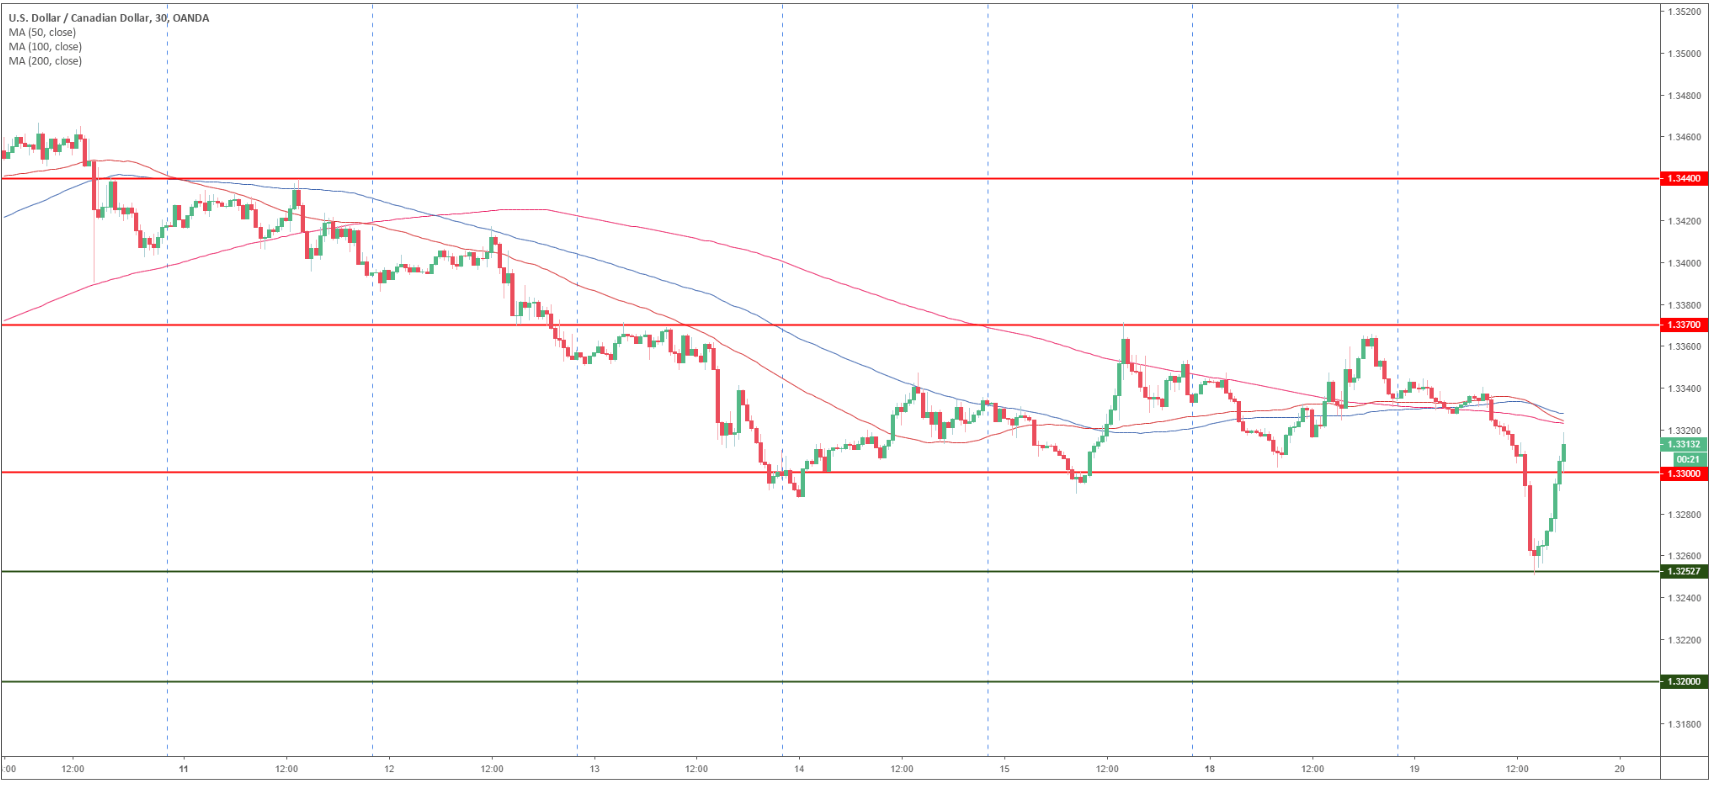
USD/CAD 30-minute chart
- USD/CAD regained the 1.3300 figure but is trading below its main SMAs suggesting bearish momentum in the short-term.
- USD/CAD remains in the 1.3370-1.3300 range for the time being.
Additional key levels
USD/CAD
Overview:
Today Last Price: 1.3304
Today Daily change: -30 pips
Today Daily change %: -0.22%
Today Daily Open: 1.3334
Trends:
Daily SMA20: 1.3287
Daily SMA50: 1.3263
Daily SMA100: 1.3304
Daily SMA200: 1.3189
Levels:
Previous Daily High: 1.3368
Previous Daily Low: 1.3302
Previous Weekly High: 1.344
Previous Weekly Low: 1.3287
Previous Monthly High: 1.3341
Previous Monthly Low: 1.3069
Daily Fibonacci 38.2%: 1.3342
Daily Fibonacci 61.8%: 1.3327
Daily Pivot Point S1: 1.3302
Daily Pivot Point S2: 1.3269
Daily Pivot Point S3: 1.3236
Daily Pivot Point R1: 1.3367
Daily Pivot Point R2: 1.34
Daily Pivot Point R3: 1.3433
