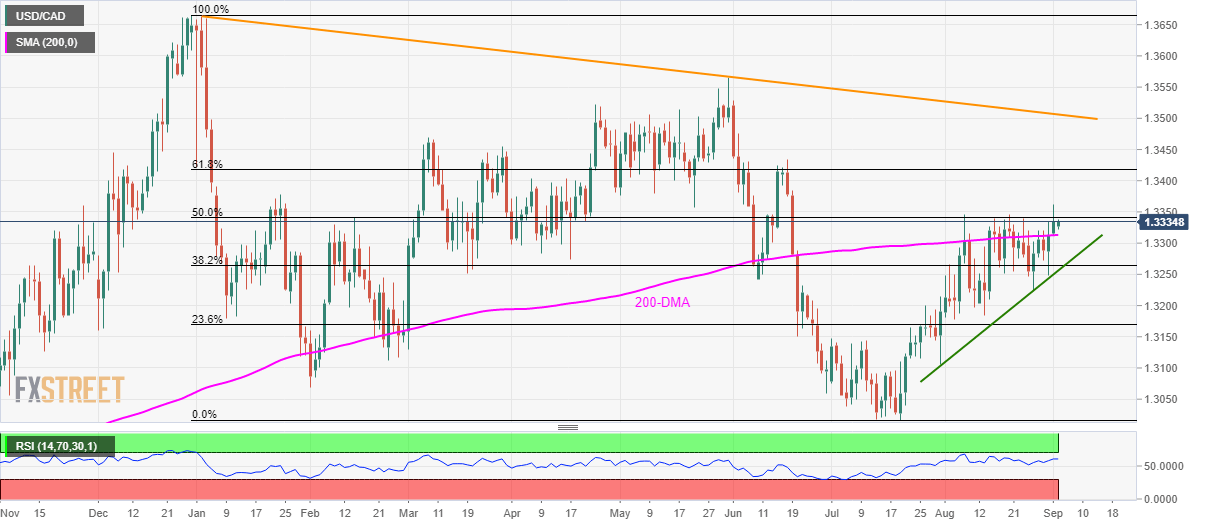
- USD/CAD successfully traders above the 200-day simple moving average (DMA).
- 50% of Fibonacci retracement acts as an immediate upside barrier.
- 38.2% Fibonacci retracement and five-week-old support-line can entertain sellers.
Despite registering another failure to cross 50% Fibonacci retracement of December 2018 to July 2019 declines on a daily closing basis, the USD/CAD pair takes the bids to 1.3337 during the Asian session on Tuesday.
While a successful rise beyond 50% Fibonacci retracement level of 1.3341 enables the pair to aim for early-May month low surrounding 1.3375/80, 61.8% Fibonacci retracement level of 1.3417 and June 18 top of 1.3434 can please buyers afterward.
Additionally, pair’s advances past-1.3434 can head to a downward sloping trend-line stretched since early-January 2019, at 1.3506 now.
In a case prices fall below 200-DMA level of 1.3313, 38.2% Fibonacci retracement of 1.3265 and a rising trend-line from July-end, at 1.3256 will be the key to watch as a break of which can recall sellers targeting sub-1.3200 mark.
USD/CAD daily chart
Trend: sideways
