- USD/CAD remains constrained in a tiny range below the 1.3500 figure
- Bulls seems to have what it takes to drive the market towards the 1.3500 figure and potentially beyond if they gather steam.
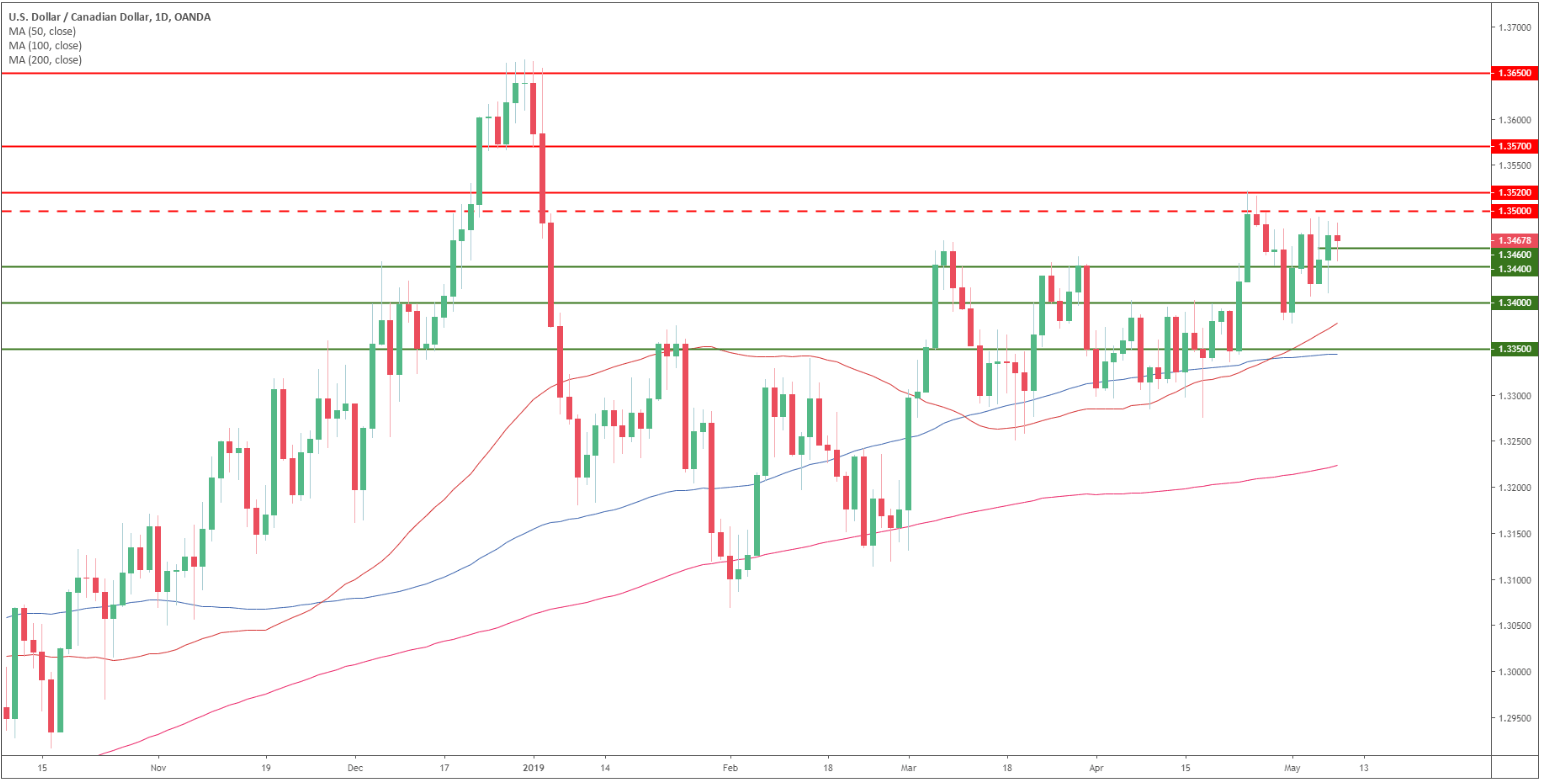
USD/CAD daily chart
USD/CAD is trading in a bull trend above its main simple moving averages (SMAs).
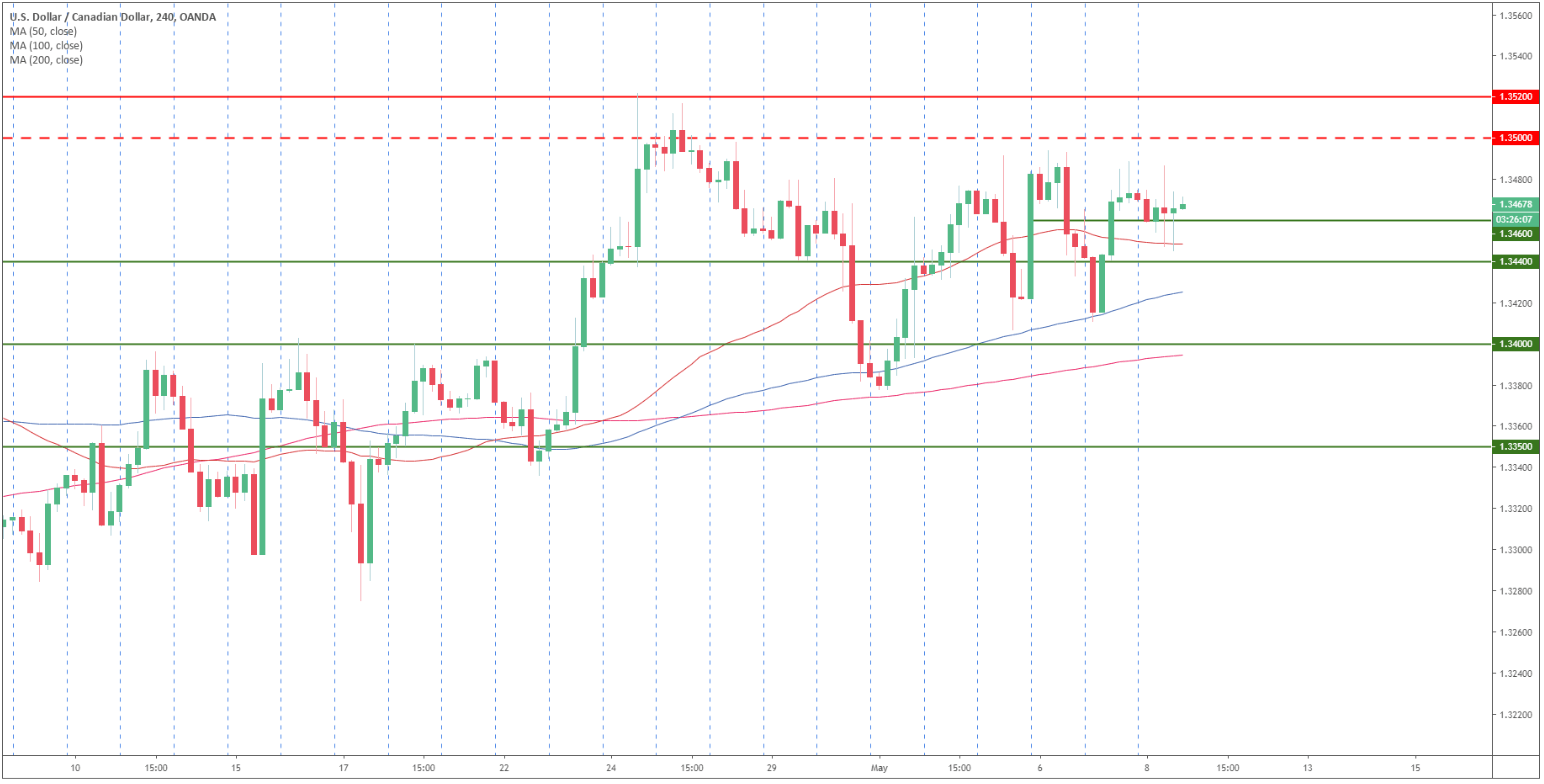
USD/CAD 4-hour chart
USD/CAD remains in a very tight range.
The market is trading above its main SMAs suggesting bullish momentum in the medium-term.

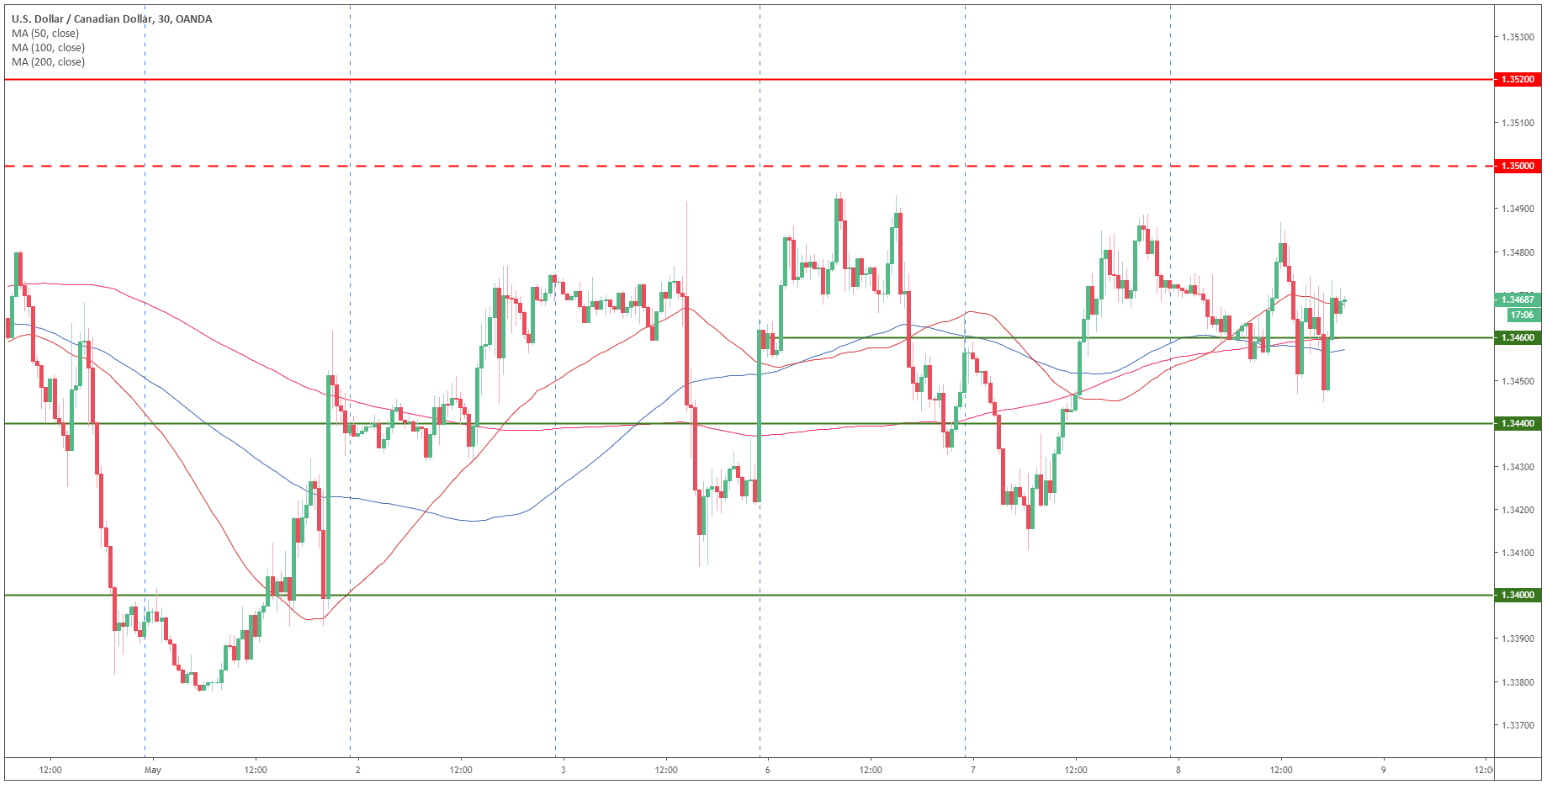
USD/CAD 30-minute chart
USD/CAD bulls are reluctant to let the market drop below 1.3440 support.
There is still scope for a run to 1.3500 and 1.3520 level which is the highest point since January 2018. After that, the next resistance is at 1.3570.
Support is at 1.3460 and 1.3440 level.

Additional key levels