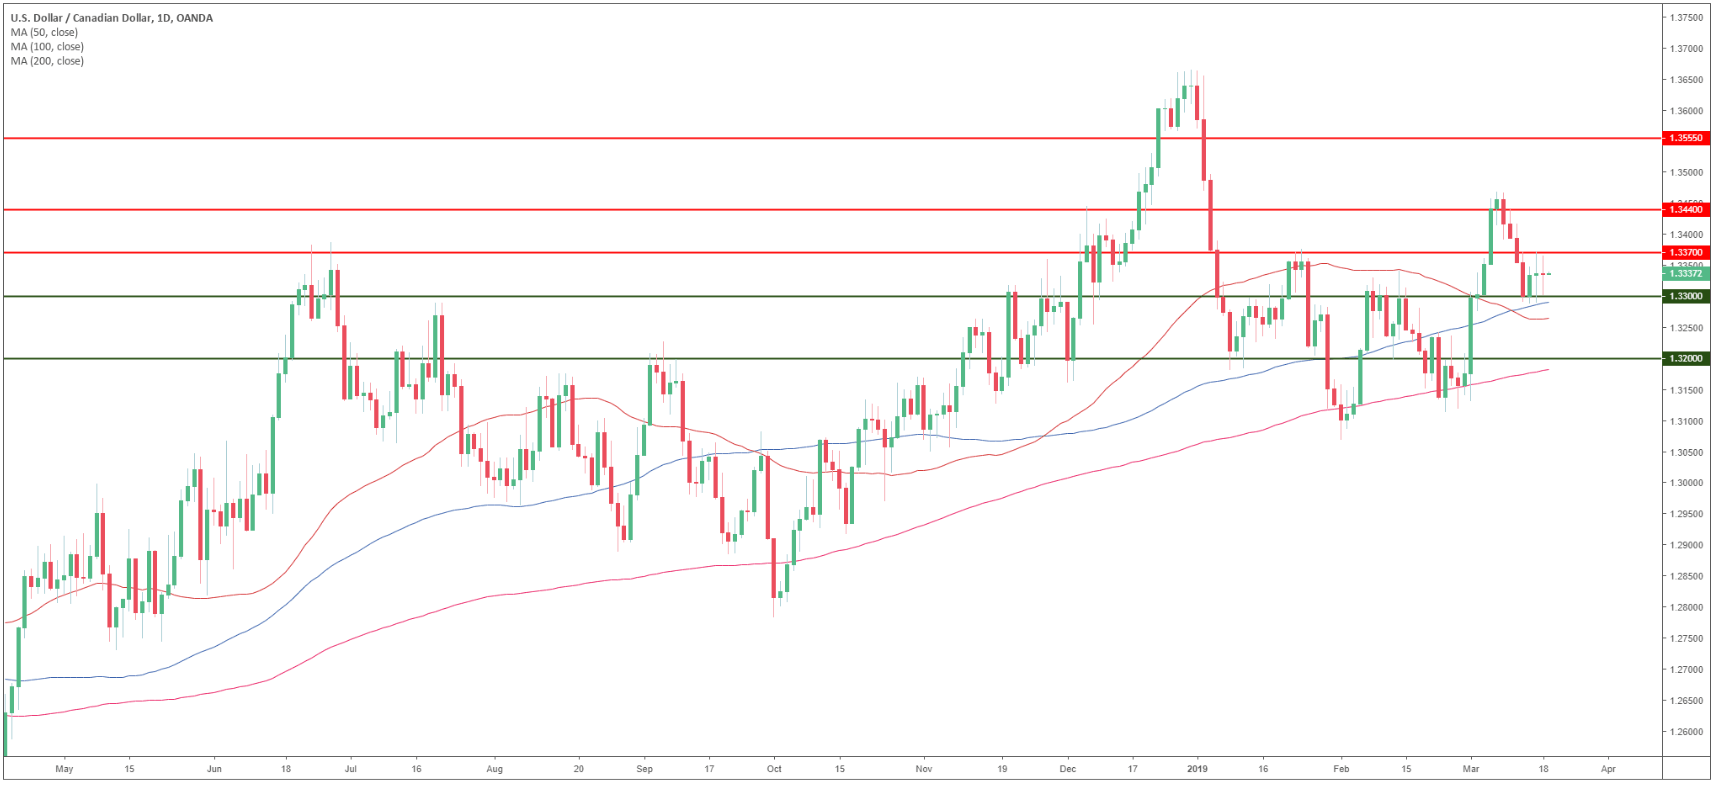
USD/CAD daily chart
- USD/CAD is trading in a bull trend above its main simple moving averages (SMAs).
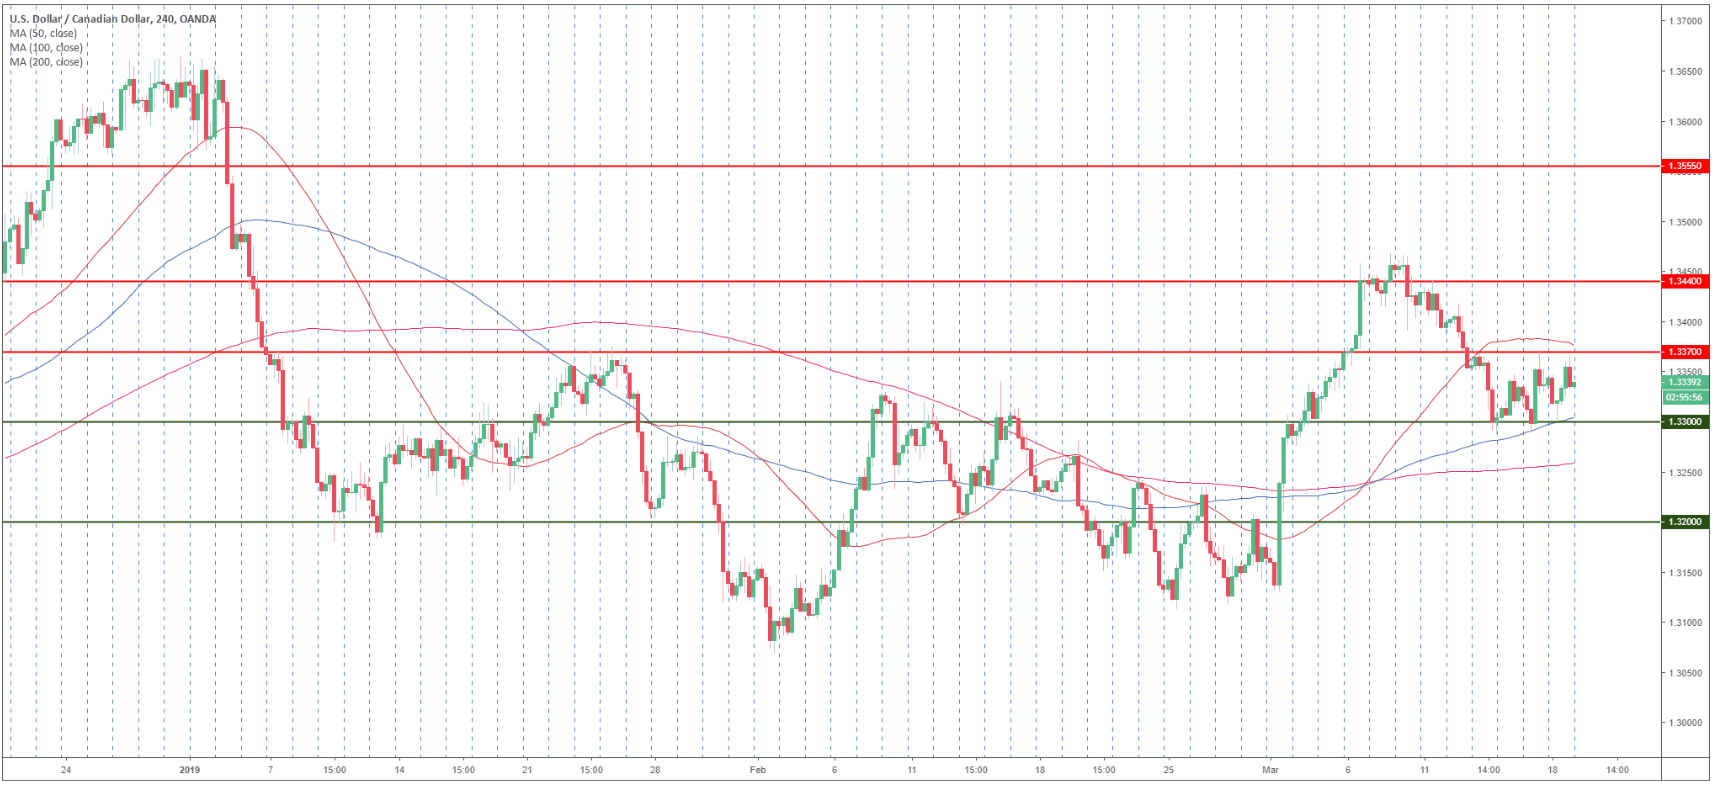
USD/CAD 4-hour chart
- USD/CAD is trading between the 50 and 100 SMAs suggesting a consolidation in the medium-term.
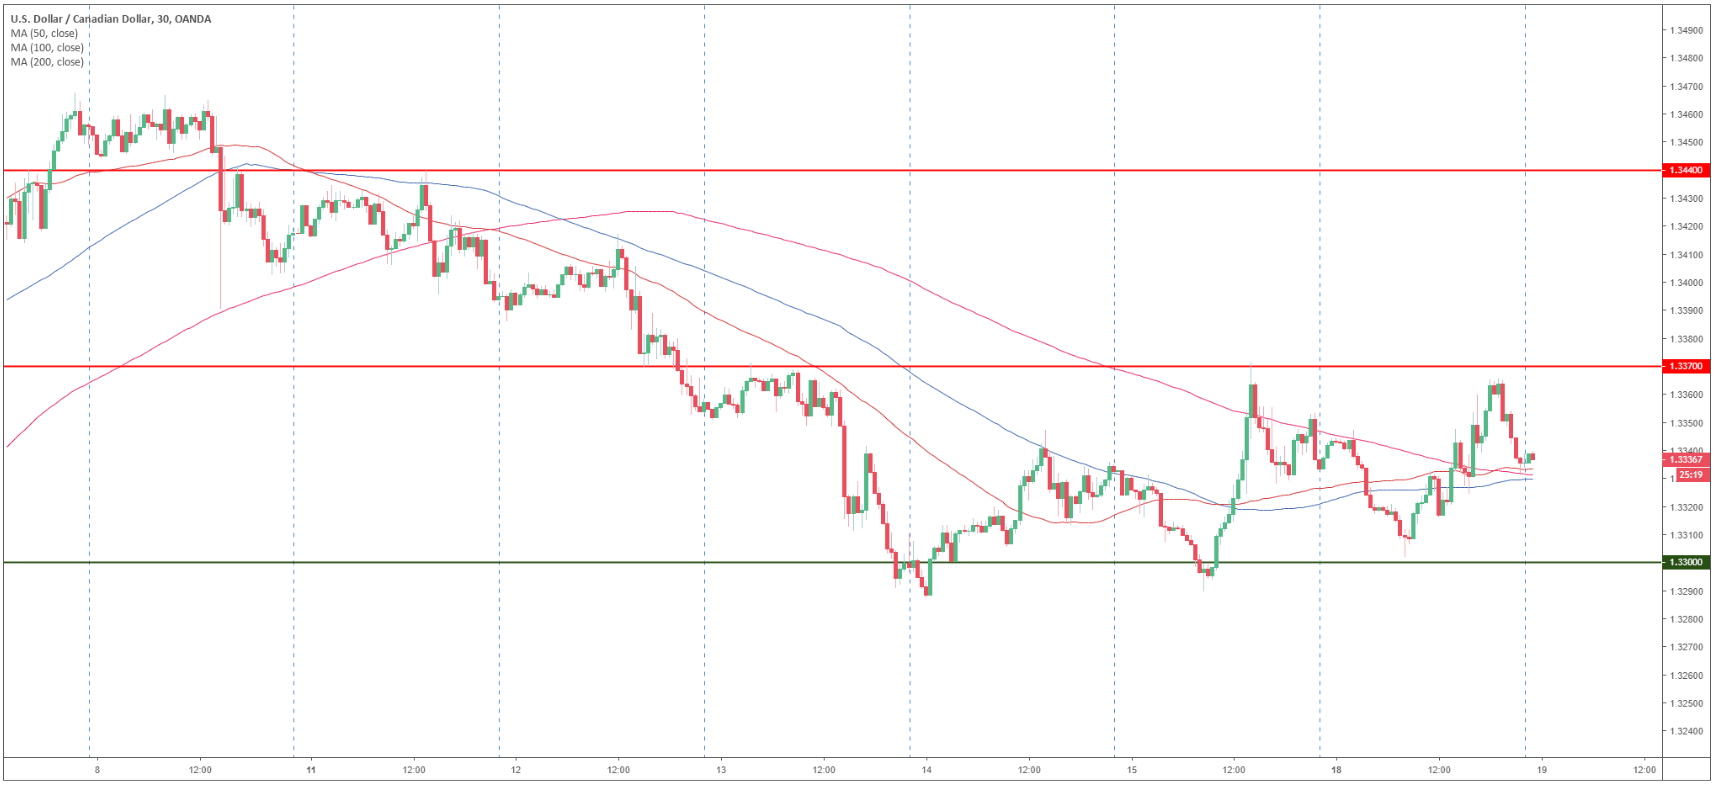
USD/CAD 30-minute chart
- USD/CAD is trading above the 1.3300 figure and its main SMAs suggesting bullish momentum in the short-term.
- A break above 1.3370 might open the doors to 1.3440 resistance.
- Support is seen at the 1.3300 and 1.3200 figure.
Additional key levels
USD/CAD
Overview:
Today Last Price: 1.334
Today Daily change: 4 pips
Today Daily change %: 0.03%
Today Daily Open: 1.3336
Trends:
Daily SMA20: 1.3282
Daily SMA50: 1.3262
Daily SMA100: 1.3302
Daily SMA200: 1.3187
Levels:
Previous Daily High: 1.3374
Previous Daily Low: 1.3289
Previous Weekly High: 1.344
Previous Weekly Low: 1.3287
Previous Monthly High: 1.3341
Previous Monthly Low: 1.3069
Daily Fibonacci 38.2%: 1.3341
Daily Fibonacci 61.8%: 1.3322
Daily Pivot Point S1: 1.3292
Daily Pivot Point S2: 1.3249
Daily Pivot Point S3: 1.3208
Daily Pivot Point R1: 1.3376
Daily Pivot Point R2: 1.3417
Daily Pivot Point R3: 1.346
