- The USD/CAD is trading with a bearish bias at the 1.2609 level amid a worse than expected US inflation figures.
- The Bureau of Labor Statistics reported a worse than expected consumer price index for the US. The Consumer Price Index for All Urban Consumers (CPI-U) increased by 0.3 percentage point.
- Forex trading participants will be looking for a sell trade below the $1.2650 level to reach the target of $1.2585 and $1.2520.
During Tuesday’s Asian trading session, the USD/CAD currency pair could not stop its previous-day declining streak and remained subdued around below $1.2650 into the European trading session. However, the factors’ combination prevented buyers from placing aggressive bets and kept the USD/CAD currency pair under pressure. The USD/CAD is trading with a bearish bias at 1.2609 level amid a worse than expected US Inflation figures.
If you are interested in trading USD/CAD with forex robots, check out our guide.
Upticks in WTI crude oil support selling bais in USD/CAD
The non-stop upticks in crude oil prices underpinned the loonie, which acted as a tailwind for the USD/CAD currency pair. Crude oil prices hit a 6-week high on the day as another hurricane threatened to bring heavy rain to Texas and parts of Louisiana that were still recovering from Ida.
In the meantime, the International Energy Agency forecasted an extensive demand recovery for the rest of the year, which also had some bullish impact on oil prices.
Bearish Bias in Greenback Weights on USD/CAD
The broad-based US dollar bearish stance, on the other hand, put additional pressure on the major. The dollar buyers moved on the sidelines and preferred to wait for a fresh catalyst from Tuesday’s release of the US consumer inflation figures. The USD/CAD currency pair is trading at 1.2658 and consolidating in the range between 1.2638 and 1.2662.
The USD/CAD currency pair regained some positive traction overnight and recovered a part of the previous day’s intraday slide from the vicinity of the 1.2700 marks.
However, the gains were short-lived or temporary as the combination of factors held buyers from placing aggressive bets and kept a lid on any meaningful gains for the USD/CAD pair. WTI crude edged higher for the third day in a row, climbing to the highest level since August 3rd, closer to the $71.00 mark, as concerns that another storm could disrupt output in the US Gulf Coast continued to weigh on oil prices.
This was seen as one of the key factors that underpinned the commodity-linked loonie and contributed to the USD/CAD currency pair. On the other hand, the broad-based US dollar weaker stance also played a major role in undermining the USD/CAD currency pair.
The US dollar dropped below a 2-1/2-week high as investors braced for inflation data that might offer clues on the timing of policy tightening by the Federal Reserve at a meeting next week.
Meanwhile, the upbeat market sentiment exerted some extra downside pressure on the dollar. Therefore, the broad-based US dollar weakness extended some pressure to the USD/CAD currency pair.
Stronger NFIB Small Business Index Underpins Greenback
During the European session, the NFIB has released the NFIB Small Business Index data. In August, the NFIB Small Business Optimism Index improved 0.4 points to 100.1. Five of the ten Index components increased in value, four decreased in value, and one remained stable. The NFIB Uncertainty Index fell seven points to 69 in January 2016, the lowest level since January 2016.
US Inflation figure disappoints.
The Bureau of Labor Statistics reported a worse than expected consumer price index for the US. The seasonally adjusted Consumer Price Index for All Urban Consumers (CPI-U) increased 0.3 percent in August, following a 0.5 percent increase in July. Before seasonal adjustment, the all-items index increased by 5.3 percent in the previous year.
The gasoline, domestic furnishings and operations, food, and housing indexes increased in August. It contributed to the monthly seasonally adjusted increase in all goods. Moreover, the energy index rose 2.0 percent, owing primarily to a 2.8 percent rise in the gasoline index. The food index increased by 0.4 percent, with both the food at home and food away from home indices rising by 0.4 percent.
The index for all products excluding food and energy increased by 0.1 percent in August, the smallest increase since February 2021.In August, the new vehicles, amusement, and medical care indexes grew alongside household operations and shelter indexes. Over the month, the indexes for airline fares, used vehicles and trucks, and motor vehicle insurance all fell.
USD/CAD Price Forecast – Technical Levels
Support Resistance
S3 1.2426
S2 1.2541
S1 1.2615
Pivot Point 1.2656
R1 1.273
R2 1.2771
R3 1.2886
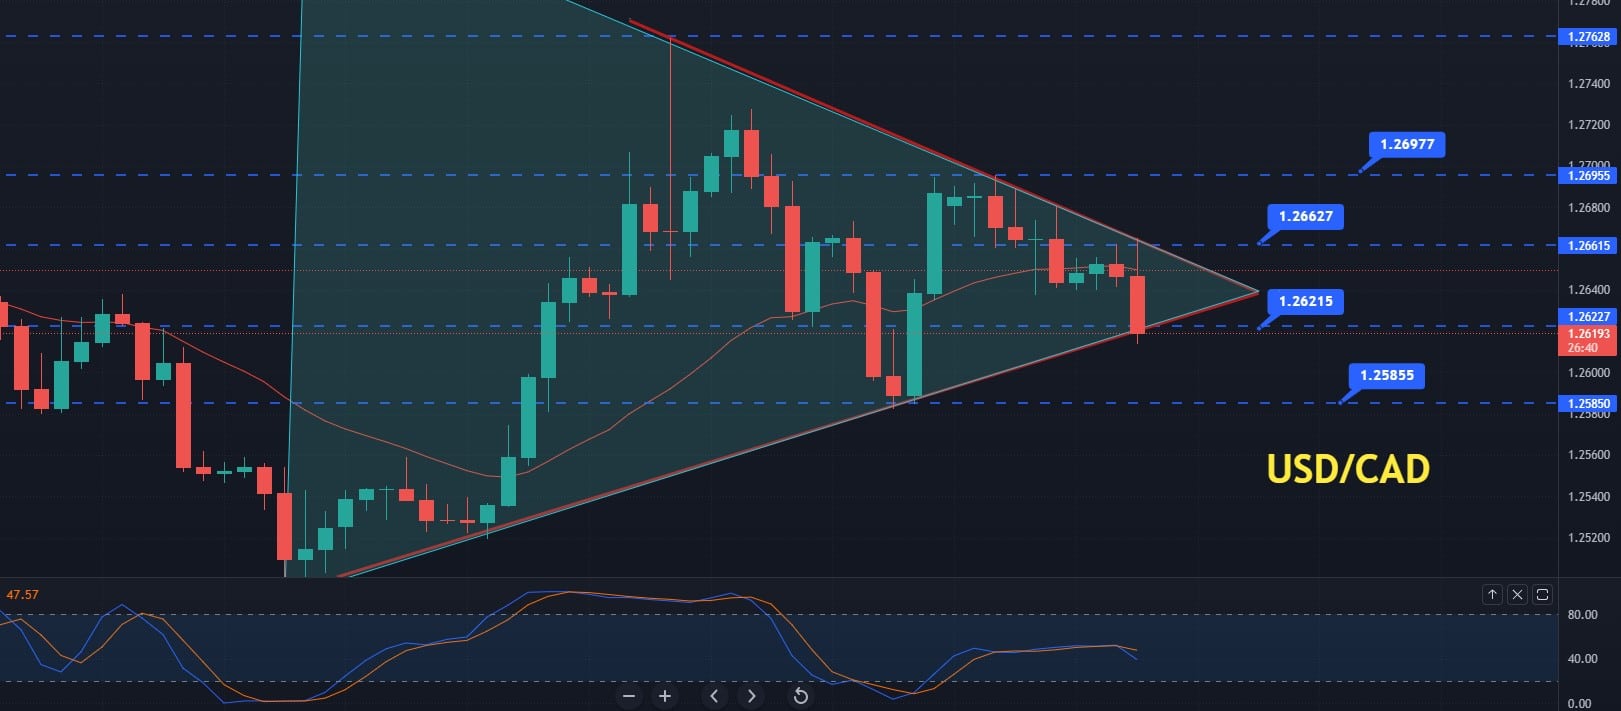
USD/CAD Violates Symmetrical Triangle Pattern – US Inflation Figures Disappoint
The USD/CAD price prediction stays bearish below an immediate resistance level of $1.2626. On the 4-hour timeframe, the USD/CAD pair has violated the symmetrical triangle pattern at the 1.2625 level. The pair formed a bearish engulfing pattern at the 1.2610 level, and the chances of a continuation of the trend remain solid.
On the 4-hours timeframe, the Canadian dollar has violated the 1.2621 level, extending a solid selling bias until the 1.2585 support level. On the bearish side, the breakout of the 1.2585 level can drive additional selling trends until the 1.2540 level.
The USD/CAD is currently trading at the 1.2625 level, facing immediate resistance at the 1.2660 level. In the 4-hour timeframe, the currency pair stays below the downward trend line, providing it with significant resistance at the 1.2660 level.
In the 4 hour timeframe, the 50 period exponential moving average provides immediate resistance at the 1.2655 level. The closing of candles below this level suggests a substantial bias for selling trends in the currency pair. However, the bearish crossover below 50 days’ exponential moving average can extend the selling trend until the next support level of 1.2585 and 1.2540.
Lastly, the leading technical tool, Stochastic RSI, holds in a sell zone below 20, confirming a bearish bias among investors. Therefore, the forex trading participants will be looking for a sell trade below the $1.2650 level to reach the target of $1.2585 and $1.2520. All the best.
Looking to trade forex now? Invest at eToro!
67% of retail investor accounts lose money when trading CFDs with this provider. You should consider whether you can afford to take the high risk of losing your money.