- USD/CHF remains on the back foot near the multi-week low.
- Bearish MACD signals further downside, key support question the sellers.
- 200-week SMA acts as the key upside barrier.
Despite bouncing off September 2018 lows, USD/CHF stays 0.11% down while trading around 0.9640 during early Monday. Also portraying the pair’s weakness are bearish conditions of MACD.
That said, a downward sloping trend line since early October 2019, at 0.9600 now, acts as the immediate support.
Also challenging the sellers is 61.8% Fibonacci retracement of the pair’s rise from February 2018 to April 2019, at 0.9585.
In a case where the bears manage to conquer 0.9585 on a weekly closing basis, September 2018 bottom surrounding 0.9540 will return to the charts.
Alternatively, 50% of Fibonacci retracement and late-February lows can question the pair’s immediate recovery around 0.9710 and 0.9770 respectively.
It should, however, be noted that the quote’s upside past-0.9770 will find it tough to cross 38.2% Fibonacci retracement and 200-week SMA, currently around 0.9835 and 0.9850 in that order.
USD/CHF weekly chart
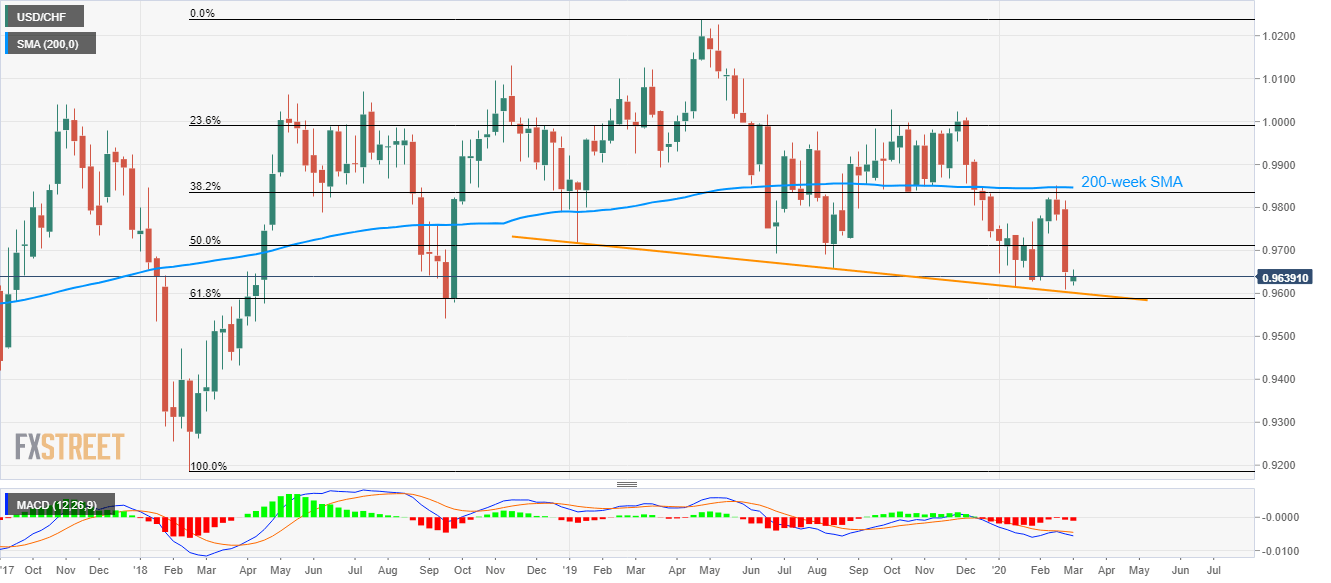
Trend: Bearish
