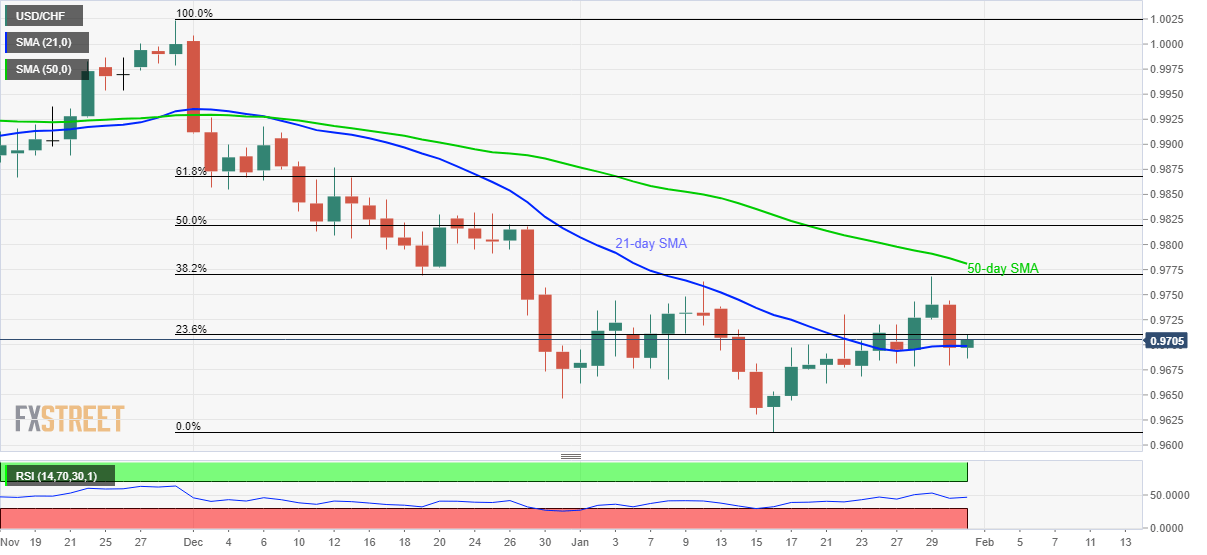
- USD/CHF confronts 23.6% Fibonacci retracement following the bounce off 21-day SMA.
- Early month lows add to the support while 38.2% Fibonacci retracement, 50-day SMA will challenge recovery moves.
USD/CHF takes the bids to 0.9707 during the pre-Europe session on Friday. In doing so, the pair repeats the tendency of staying beyond 21-day SMA while also confronting 23.6% Fibonacci retracement of its declines from November 29, 2019, to January 16, 2020.
The sustained trading above short-term SMA is likely to extend the pair’s pullback moves toward a 38.2% Fibonacci retracement level of 0.9770, following the clear break of 0.9820 mark comprising 23.6% of Fibonacci retracement.
However, a 50-day SMA level near 0.9781 and late-December 2019 top surrounding 0.9830 will challenge the buyers.
Alternatively, pair’s daily closing below 21-day SMA level of 0.9700 may recall early-month bottoms close to 0.9665 ahead of testing the monthly low of 0.9613.
USD/CHF daily chart
Trend: Trend: Pullback expected
