- USD/CHF extends losses from 0.9044 to revisit the lowest levels since January 2015, flashed the previous day.
- Bearish MACD, sustained break of February 2018 low join broad US dollar weakness to keep the sellers hopeful.
- March 2014 bottom, 50% Fibonacci retracement becomes the strong support.
USD/CHF drops to 0.9008, down 0.32% on a day, amid the major USD drop during the pre-European session on Tuesday. Although the previous day’s bottom surrounding the early 2015 trough may become immediate support for the traders, major attention is given to the key Fibonacci retracement levels of the pair’s 2011-16 upside.
Hence, the pair’s further selling awaits a clear break below 0.9000 round-figures to eye the late-January 2015 top surrounding 0.8840.
However, bears are less likely to move away from the 50% and 61.8% Fibonacci retracement levels, respectively at 0.8700 and 0.8313, during the downside past-0.8840.
On the contrary, February 2018 low near 0.9190 becomes the immediate strong upside barrier ahead of the previous month’s high near 0.9245.
In a case where the quote manages to rise beyond 0.9245, it can aim for the early July’s low surrounding 0.9360.
USD/CHF monthly chart
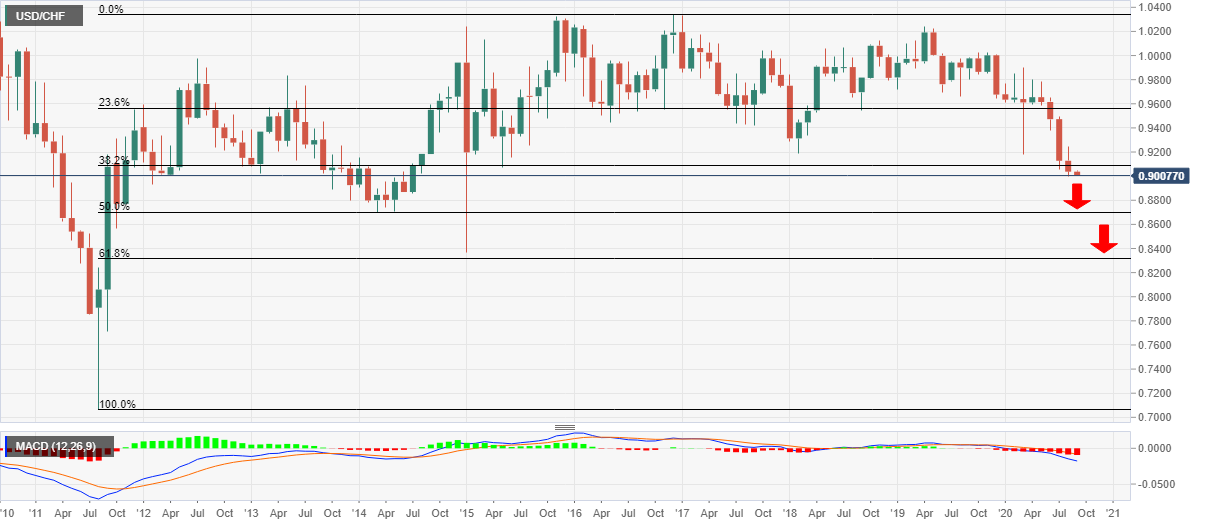
Trend: Bearish
