- USD/CHF recovers from 0.9652 following a bullish candlestick formation.
- 200-bar EMA, 61.8% Fibonacci retracement can check the pullback moves.
- Sustained break of 23.6% Fibonacci retracement will negate upside momentum.
USD/CHF portrays gradual recovery from the intraday low while taking the bids near 0.9670, up 0.13% on a day, during the pre-European session on Wednesday.
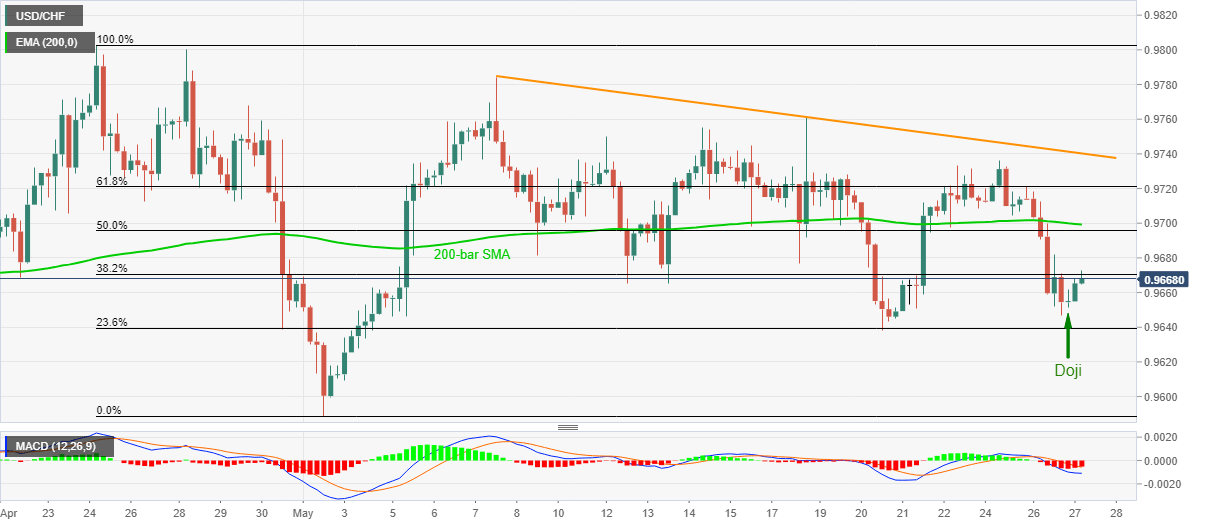
Considering the bullish Doji formation on the four-hour (H4) chart, odds of further upside towards a 200-bar EMA level of 0.9700 are high.
Should buyers manage to keep the reins past-0.9700, 61.8% Fibonacci retracement of April 24 to May 01 fall, around 0.9720, followed by a three-week-old falling trend line, near 0.9740, could question the bulls.
Alternatively, the pair’s declines below 0.9640, comprising 23.6% of Fibonacci retracement, could recall the bears targeting the monthly low near 0.9590.
USD/CHF four-hour chart
Trend: Further recovery expected
