- USD/CHF rises for the third consecutive day despite failing to provide a daily close beyond 50-day SMA.
- Normal RSI conditions, sustained trading beyond 21-day SMA directs buyers toward a falling trend line from August 03.
- Sellers may wait for the downside break of the September 10 low before taking any entries.
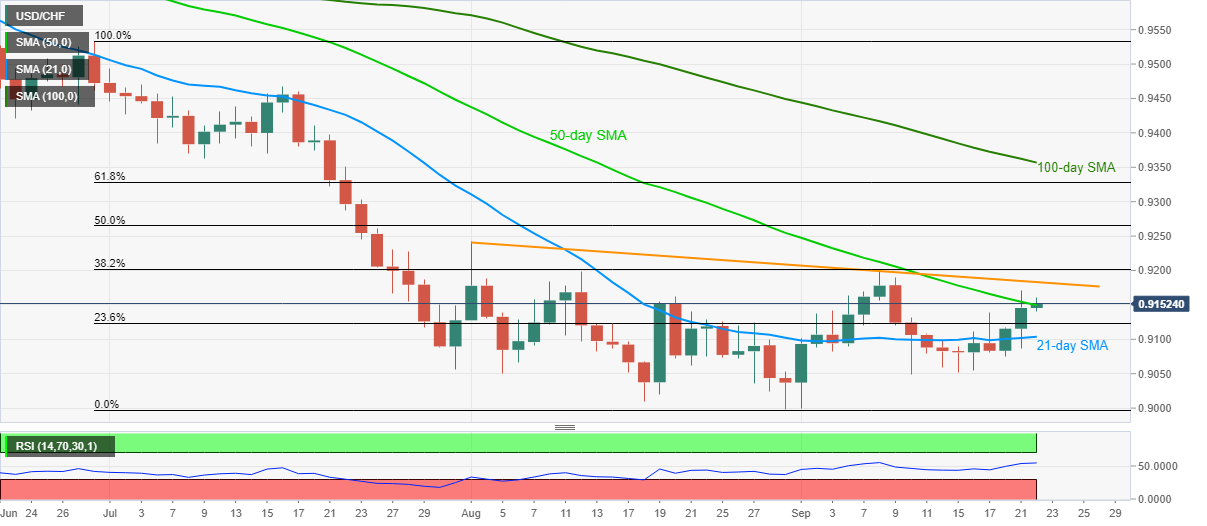
USD/CHF remains mildly bid while trading near 0.9153 during early Tuesday. The pair buyers cheer the successful break of the 21-day SMA amid normal RSI conditions but the 50-day SMA seems to limit the immediate upside.
Even if the quote closes beyond the said SMA resistance of 0.9150, a seven-week-old resistance line near 0.9180 can will question further upside by USD/CHF.
Should the bulls manage to conquer 0.9180, the 0.9200 threshold and 61.8% Fibonacci retracement of June 30 to August 31 fall, close to 0.9330, will be on their radars.
On the contrary, a downside break of 21-day SMA, currently around 0.9100, will not be enough to recall the sellers as there are multiple supports adjacent to 0.9050/45 that also includes September 10 bottom.
Furthermore, the August month’s low of 0.8998 and the late January 2015 high around 0.8770 are likely levels that can lure the bears past-0.9045.
USD/CHF daily chart
Trend: Pullback expected
