- USD/CHF extends recovery moves from 0.9425, the lowest since March 16.
- Confirmation of a bullish chart pattern, RSI recovery from oversold territory favors the buyers.
- Bears may look for a sustained break of 0.9400 for fresh entry.
USD/CHF takes the bids near 0.9450, up 0.11% on a day, during the pre-European session on Thursday. The pair recently reversed from three-month low while also confirming a bullish formation on the hourly chart. Also increasing the odds of the pair’s further upside are the RSI conditions that take a U-turn from the oversold area.
Having said that, the quote seems to rise towards Tuesday’s low above 0.9480 ahead of targeting 0.9500 round-figure.
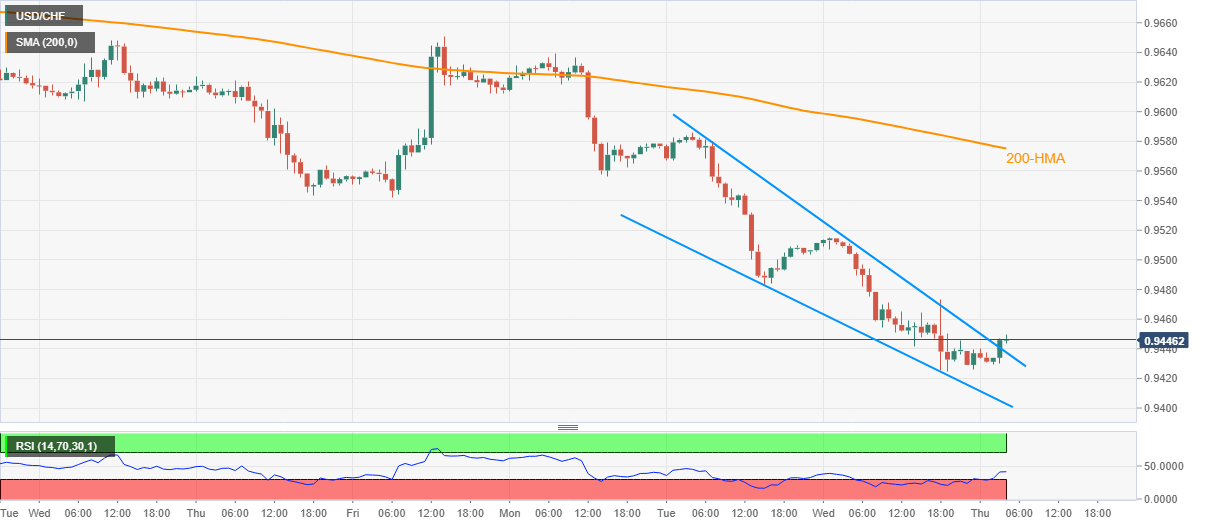
However, Friday’s bottom close to 0.9540 and 200-HMA surrounding 0.9575 could chain the buyers afterward.
On the downside, sellers might await a clear break below 0.9400 threshold for fresh entry to refresh multiday low. As a result, 0.9320 and March month low near 0.9180 might lure the bears during additional weakness.
USD/CHF hourly chart
Trend: Further recovery expected
