- USD/CHF remains mildly bid near two-week top amid bullish MACD, upbeat RSI.
- Key Fibonacci retracements challenge bulls ahead of December top.
- Previous resistance line from November adds to the downside filters.
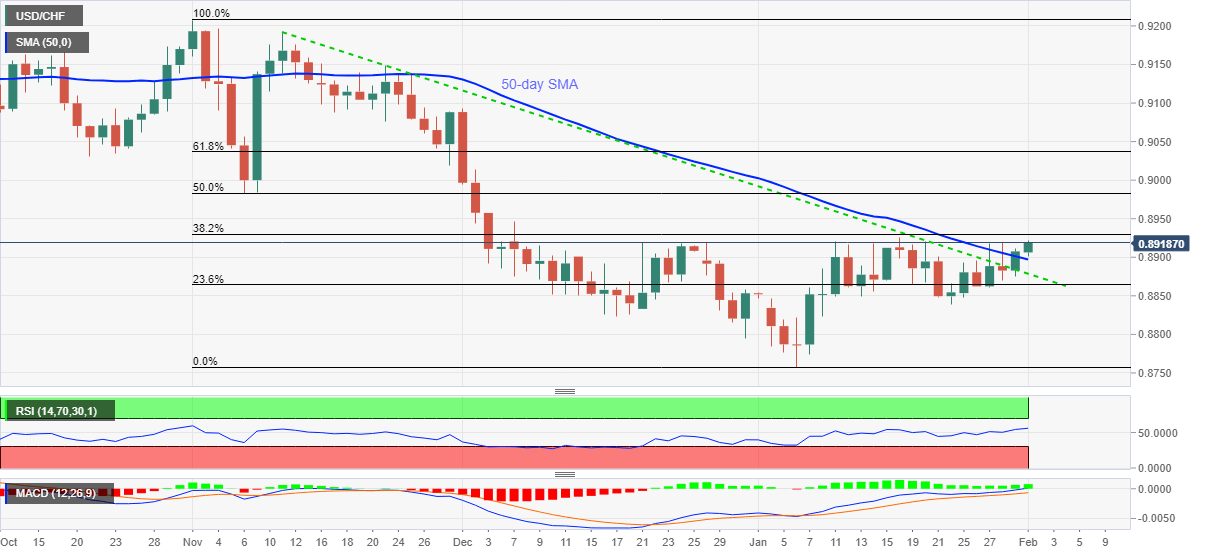
USD/CHF picks up bids near 0.8920, up 0.13% intraday, during the pre-European session on Monday. In doing so, the pair extends its first daily closing above 50-day SMA since November 13 and a 12-week-old trend line breakout.
With the bullish MACD and strong RSI conditions, not overbought, favoring USD/CHF buyers, the quote is up for challenging December 07 high near 0.8950 ahead of confronting 50% Fibonacci retracement of November 2020 to January 2021 downside, around 0.8985.
In a case where USD/CHF bulls keep the reins and the RSI refrains from overbought conditions beyond 0.8985, the 61.8% Fibonacci retracement and December 2020 peak, respectively around 0.9035 and 0.9095, also near the 0.9100 round-figure, should be followed closely.
On the contrary, a downside break of 50-day SMA, at 0.8897 now, needs to break the previous resistance line, now support, around 0.8875, to aim for January 22 low near 0.8840.
During the pair’s weakness past-0.8840, December 17 low close to 0.8820 and the monthly bottom of 0.8757 will be the key.
Overall, the USD/CHF bulls are back to the game and can eye the 0.9000 threshold during the further upside.
USD/CHF daily chart
Trend: Bullish
