- USD/CHF pulls back from a two-month high.
- 50% and 61.8% Fibonacci retracements add barriers to the trading range.
USD/CHF steps back from multi-day top to 0.9835 during the early Thursday’s trading session. In doing so, the pair fails to cross 61.8% Fibonacci retracement of its fall between November 2019 and January 2020. However, an ascending trend line since February 12 restricts the pair’s immediate declines.
While nearly overbought RSI conditions favor the pair’s declines, 50% Fibonacci retracement will add strength to the immediate support-line around 0.9820.
Alternatively, 200-day SMA near 0.9860 acts as the immediate resistance ahead of the 61.8% Fibonacci retracement level around 0.9870.
If at all USD/CHF prices break the 0.9820/70 range on the upside, December 06, 2019 high near 0.9920 could gain market attention whereas January month high close to 0.9770 can please sellers during the downside break of the said range.
USD/CHF daily chart
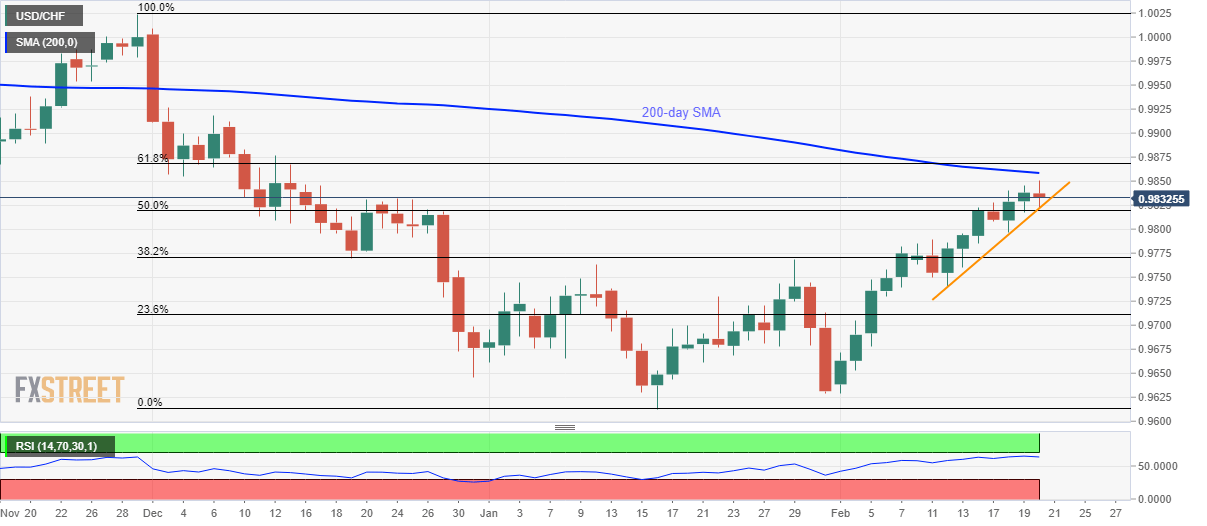
Trend: Pullback expected
