- USD/CHF refreshes the weekly high while extending recovery moves from 0.9064.
- Key Fibonacci retracement levels are on the bulls’ radars.
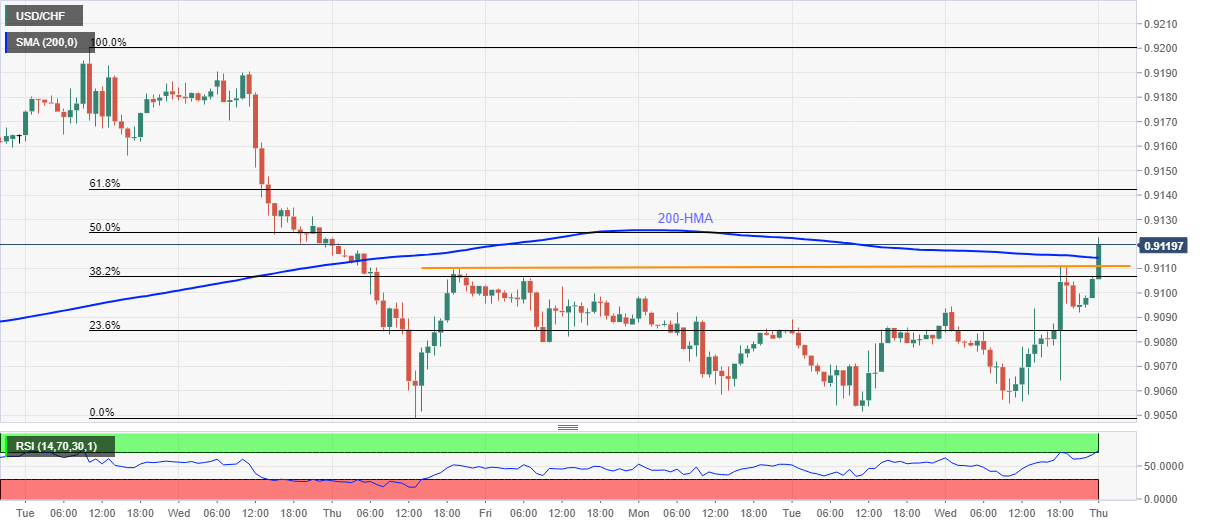
- A one-week-old horizontal line around 0.9110 adds to the downside support.
USD/CHF rises to 0.9118, intraday high 0.9122, during the early Thursday’s trading. The Swiss major recently gained bids after breaking 200-HMA. Other than the important HMA level, the quote also crossed the short-term horizontal resistance line while extending the post-Fed run-up.
In doing so, the quote ignores overbought RSI conditions and head towards 50% and 61.8% Fibonacci retracement level of September 08-10 downside, respectively near 0.9125 and 0.9145.
Though, the September 09 low of 0.9156 and 0.9190 may offer intermediate halts to the USD/CHF rally towards the monthly high 0.9200.
Meanwhile, a downside break 200-HMA, at .9114 now, will have to slip beneath the 0.9110 horizontal support to recall the 0.9100 threshold on the chart.
During the pair’s further weakness past-0.9100, multiple supports between 0.9055 and 0.9048 can entertain the sellers.
USD/CHF hourly chart
Trend: Further upside expected
