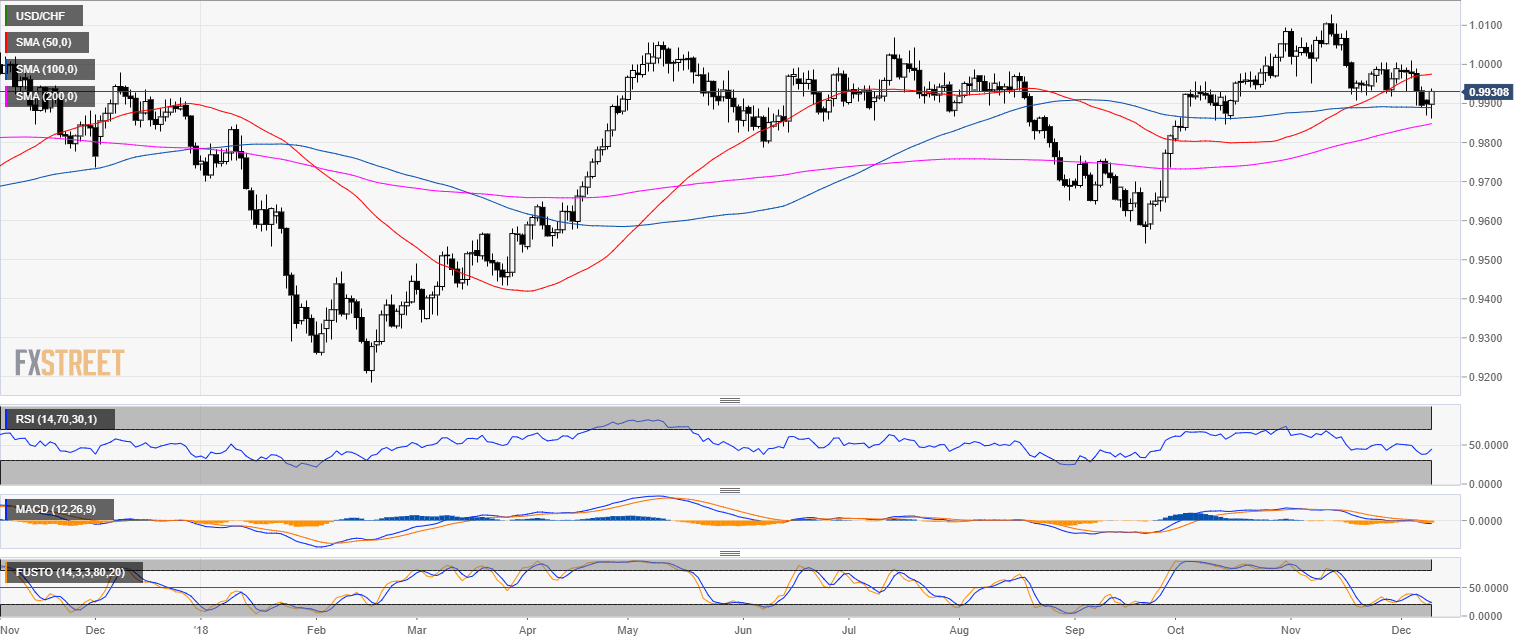
USD/CHF daily chart
- USD/CHF is trading in a bull trend above the 200-day simple moving average (SMA).
- USD/CHF found support at the 100 SMA.
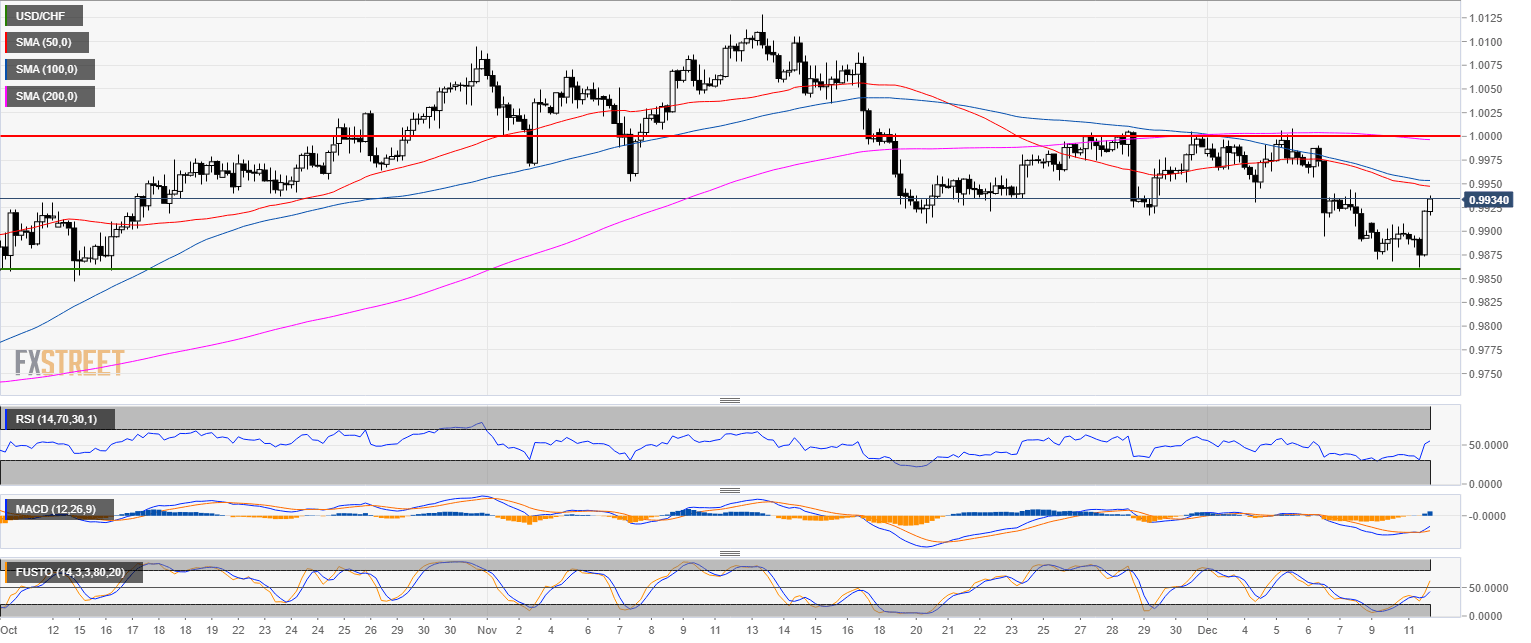
USD/CHF 4-hour chart
- USD bulls are looking for a retest of the parity level.
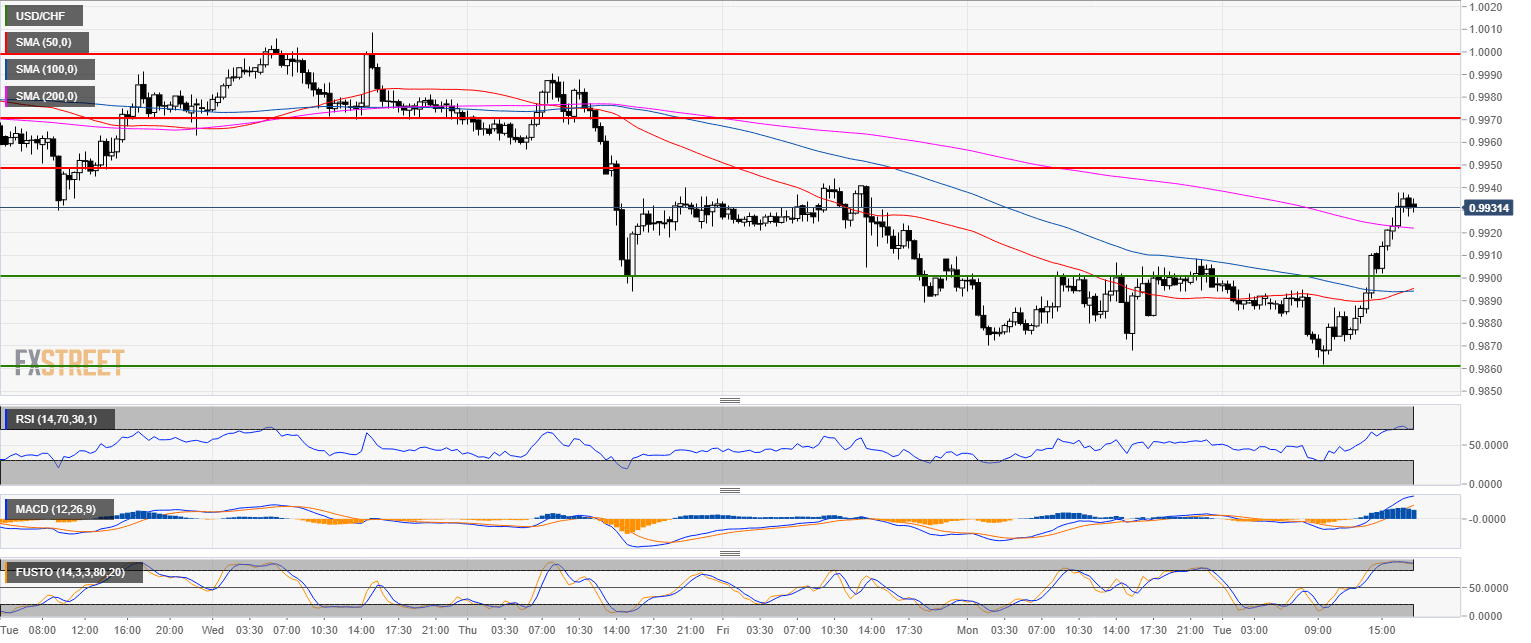
USD/CHF 30-minute chart
- The 0.9950 is the level to beat for bulls.
- A break above the level would open the gates to 0.9970 and the parity level.
- To the downside, 0.9900 should act as support.
Additional key levels
USD/CHF
Overview:
Today Last Price: 0.9932
Today Daily change: 33 pips
Today Daily change %: 0.333%
Today Daily Open: 0.9899
Trends:
Previous Daily SMA20: 0.9974
Previous Daily SMA50: 0.9973
Previous Daily SMA100: 0.989
Previous Daily SMA200: 0.9843
Levels:
Previous Daily High: 0.991
Previous Daily Low: 0.9868
Previous Weekly High: 1.0009
Previous Weekly Low: 0.9889
Previous Monthly High: 1.0129
Previous Monthly Low: 0.9908
Previous Daily Fibonacci 38.2%: 0.9884
Previous Daily Fibonacci 61.8%: 0.9894
Previous Daily Pivot Point S1: 0.9875
Previous Daily Pivot Point S2: 0.985
Previous Daily Pivot Point S3: 0.9833
Previous Daily Pivot Point R1: 0.9916
Previous Daily Pivot Point R2: 0.9934
Previous Daily Pivot Point R3: 0.9958
