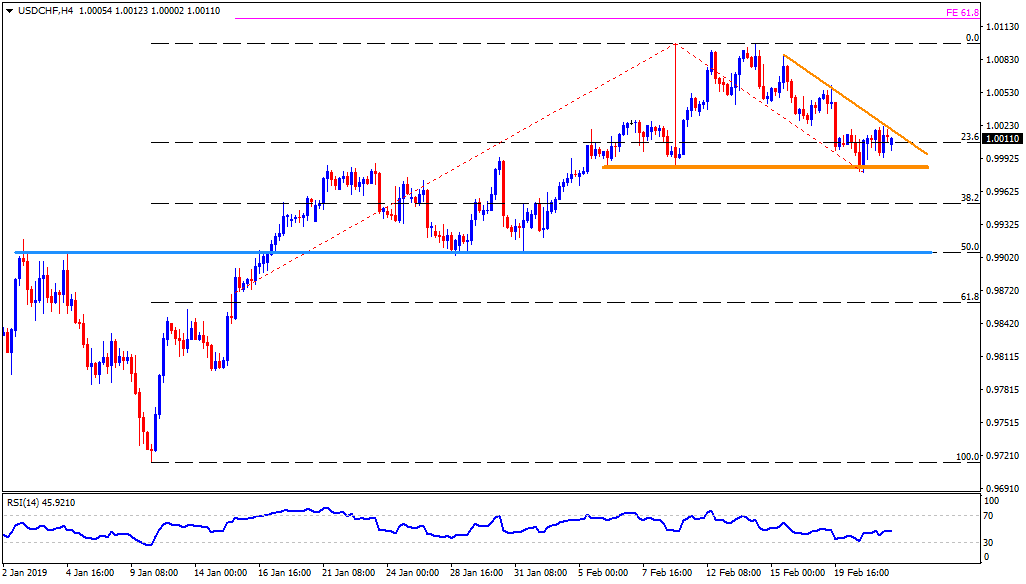
- USD/CHF trades near 1.0010 during early Friday.
- The pair’s failure to surpass a weeklong descending resistance-line favors its drop to 0.9990-85 horizontal-support.
- Should sellers refrain to respect the 0.9985 support, 38.2% Fibonacci retracement of its early 2019 upside, at 0.9950, can offer intermediate halt during the slump targeting 0.9905 level comprising 50% Fibonacci.
- If at all prices decline past-0.9905, 0.9845 and 0.9800 should become bears’ favorites.
- On the contrary, the pair’s ability to cross 1.0020 resistance-line could trigger its pullback towards 1.0040 and 1.0075.
- Given the bulls dominate after 1.0075, 1.0100 is a crucial resistance to watch as it holds the gate for the pair’s rise to 61.8% Fibonacci expansion (FE) level of mid-January to February moves, at 1.0120, followed by 1.0150 and 1.0180 levels.
USD/CHF 4-Hour chart
Additional important levels:
Overview:
Today Last Price: 1.0014
Today Daily change: 3 pips
Today Daily change %: 0.03%
Today Daily Open: 1.0011
Trends:
Daily SMA20: 1.0001
Daily SMA50: 0.9934
Daily SMA100: 0.9955
Daily SMA200: 0.991
Levels:
Previous Daily High: 1.0024
Previous Daily Low: 0.9994
Previous Weekly High: 1.01
Previous Weekly Low: 0.9988
Previous Monthly High: 0.9996
Previous Monthly Low: 0.9716
Daily Fibonacci 38.2%: 1.0013
Daily Fibonacci 61.8%: 1.0005
Daily Pivot Point S1: 0.9996
Daily Pivot Point S2: 0.998
Daily Pivot Point S3: 0.9966
Daily Pivot Point R1: 1.0026
Daily Pivot Point R2: 1.004
Daily Pivot Point R3: 1.0056
