- USD/CHF takes another U-turn from 100-day SMA, takes the bids above 38.2% Fibonacci retracement.
- 61.8% Fibonacci retracement acts as the key support while 200-day SMA holds the pair’s recovery confined.
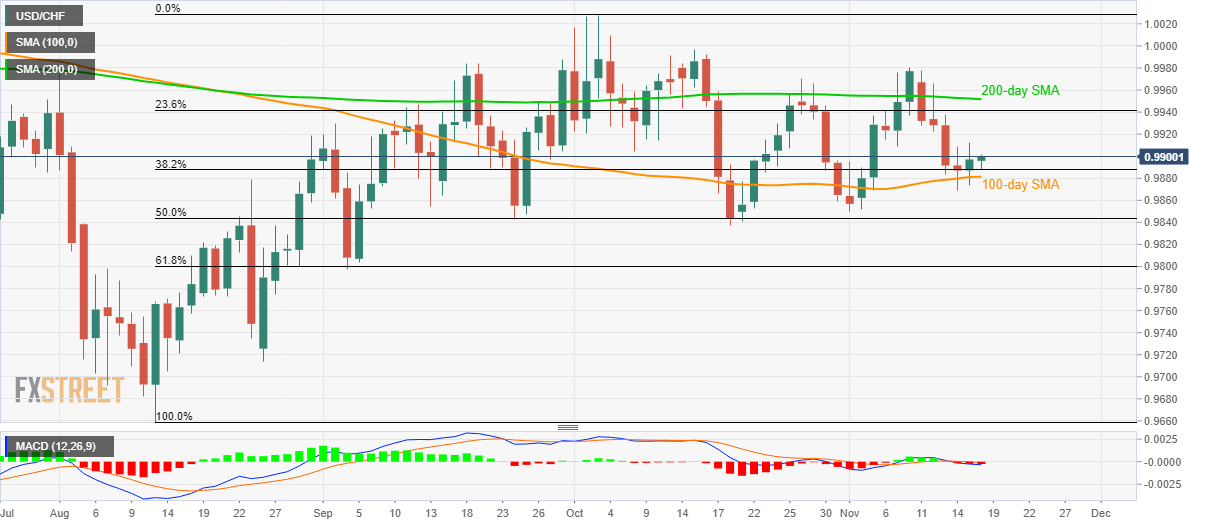
Following its bounce off 100-day SMA, USD/CHF rises past-38.2% Fibonacci retracement of August-October upside while taking the bids to 0.9900 by the press time ahead of the European session on Monday.
Considering the pair’s recent recovery from near-term strong support, prices could revisit 0.9925/30 resistance area ahead of confronting 23.6% Fibonacci retracement level near 0.9942. However, 200-day Simple Moving Average (SMA) level of 0.9952 continues to act as strong upside barrier.
Should there be a clear run-up beyond 0.9952, the monthly top surrounding 0.9980 and 1.0000 could act as buffers prior to fueling the quote towards October month high close to 1.0030.
Meanwhile, pair’s daily closing below 100-day SMA level of 0.9880 can fetch it towards the previous month’s bottom nearing 0.9835.
Though, 61.8% Fibonacci retracement and September month lows near 0.9800 could please sellers bears afterward.
USD/CHF daily chart
Trend: Recovery expected
