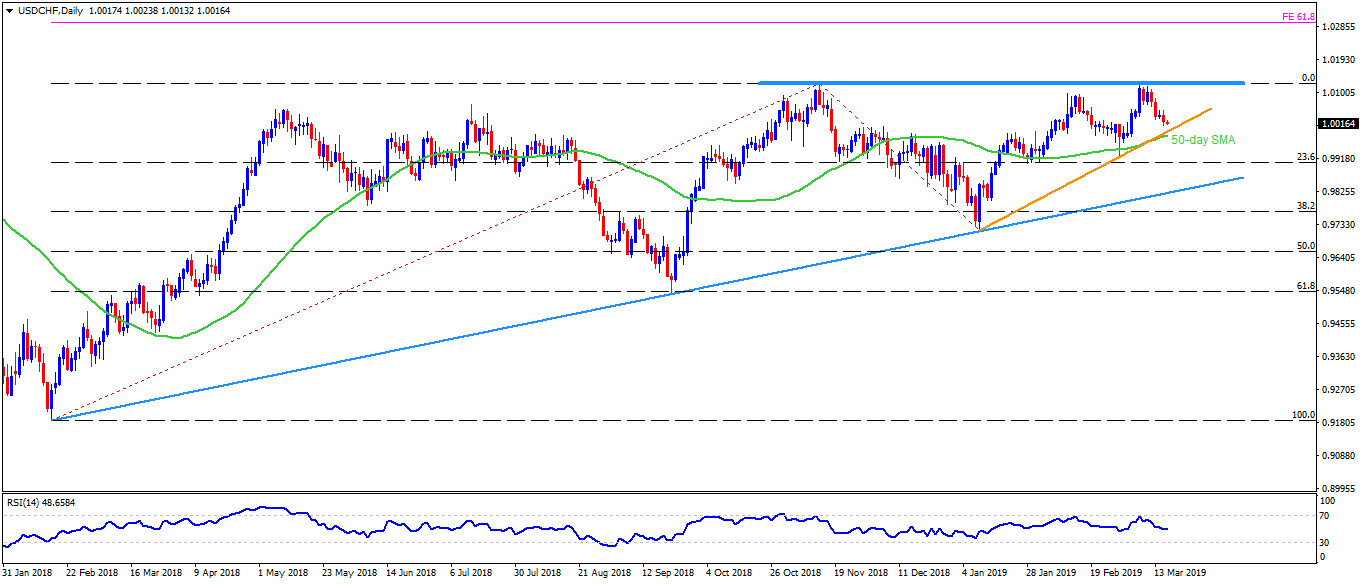
USD/CHF daily chart
- USD/CHF trades near 1.0015 while heading towards European session on Monday.
- The quote took a U-turn from 1.0120/30 area, including November 2018 high and early-month top, with the downward slopping 14-day relative strength index (RSI) signaling weakness in the sentiment.
- Though, 50-day simple moving average (SMA) and an ascending support-line connecting January and February lows could challenge sellers around 0.9990/80.
- Should bears refrain to respect 0.9980 rest-point, 23.6% Fibonacci retracement of February – November 2018 increase, at 0.9900, could become their favorite.
- Alternatively, 1.0065/70 can offer immediate resistance to the pair ahead of fuelling it to the 1.0120/30 region.
- Should there be increased upside momentum past-1.0130, the pair could aim for 1.0300 mark comprising 61.8% Fibonacci expansion (FE) of the previously said upside.
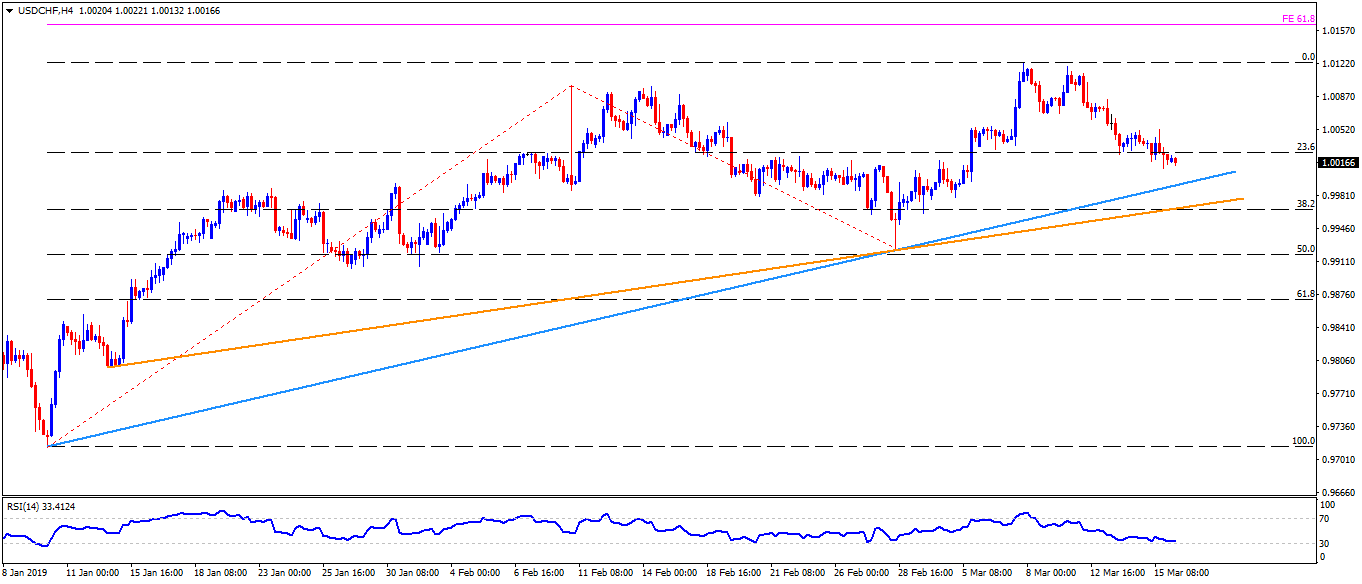
USD/CHF 4-Hour chart
- In addition to 0.9980 an upward sloping trend-line joining January 14 lows to February ones, coupled with 38.2% Fibonacci retracement of January to March upside, at 0.9965/60, can also offer strong support to the pair prices.
- Meanwhile, 61.8% FE level of January – February moves, at 1.0165 can offer a halt to a rally past-1.0130.
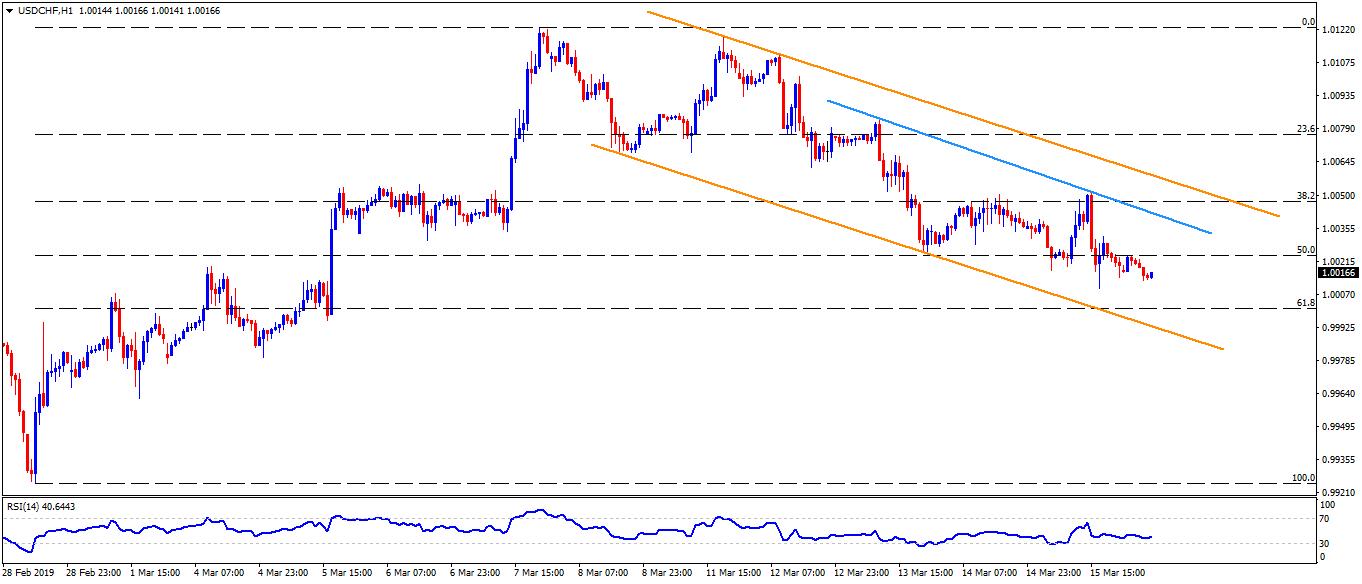
USD/CHF hourly chart
- 0.9940 might become an extra rest between 0.9960 and 0.9900 if observing H1 chart.
- 1.0045 seems adjacent trend-line resistance for buyers to watch.