- USD/CHF again aims to break two-month long rising trend-line, part of a bearish technical formation.
- Bullish MACD can trigger an uptick to 61.8% Fibonacci retracement.
Sustained trading above 0.9948/50 confluence again propels USD/CHF to confront near-term key resistance-line while taking the bids to 0.9988 amid Tuesday’s Asian session.
A rising trend-line since August-start, coupled with another one connecting lows marked since August 13, portrays a short-term bearish technical formation that gets confirmed on the break of the support line.
However, pair’s run-up beyond 0.9990 resistance will defy the pattern and could extend the run-up to 61.8% Fibonacci retracement level of April-August declines, at 1.0016.
During the pair’s further advances past-1.0016, mid-May lows nearing 1.0050 and 1.0100 will flash on bulls’ radar.
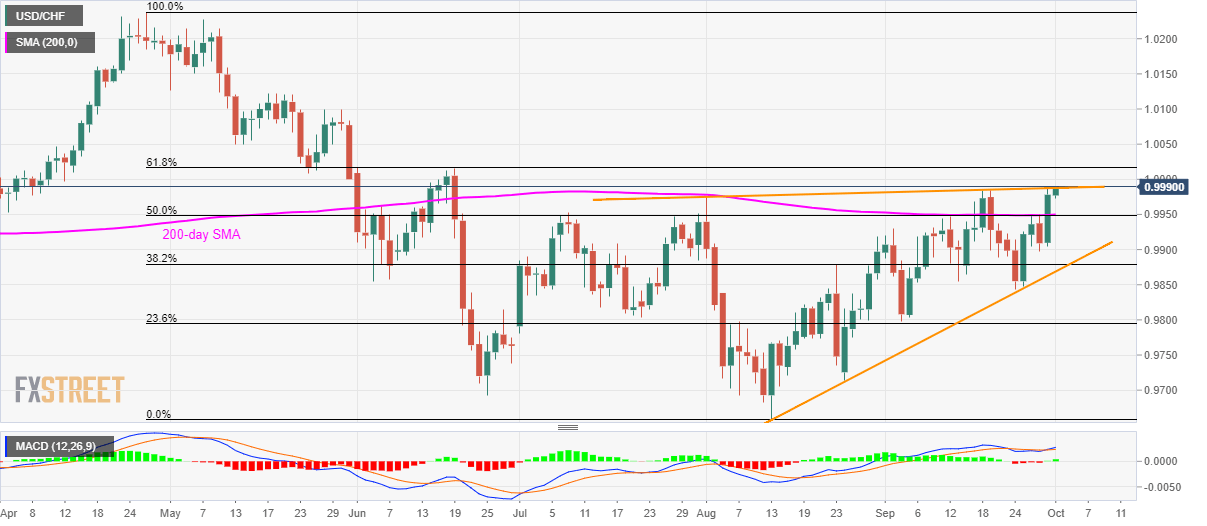
Alternatively, pair’s decline below 0.9950/48 support-confluence including 200-day simple moving average (SMA) and 50% Fibonacci retracement could recall 0.9900 to the chart while formation’s support-line close to 0.9870 might challenge bears then after.
USD/CHF daily chart
Trend: bullish
