- USD/CHF follows an eight-day-old falling trend line that restricts pair’s immediate upside.
- Confirmation of the bullish technical pattern can challenge the monthly top.
With the USD/CHF pair’s sustained trading below the descending trend line stretched since November 08, a short-term bullish formation appears on the hourly (H1) chart. Though, the quote declines to 0.9900 while heading into the European open on Wednesday.
Bearish signals from 12-bar Moving Average Convergence and Divergence (MACD) increases the odds for the pair’s further declines to 0.9870 and then to the monthly bottom around 0.9850.
Though, October low of 0.9837 holds the keys to pair’s drop to 0.9800 round-figure.
Alternatively, a sustained break of 0.9915 will confirm the bullish chart pattern and trigger fresh run-up to a theoretical target around 1.0015. However, November 12 high around 0.9965, followed by the monthly top close to 0.9980, can entertain buyers during the rise.
USD/CHF hourly chart
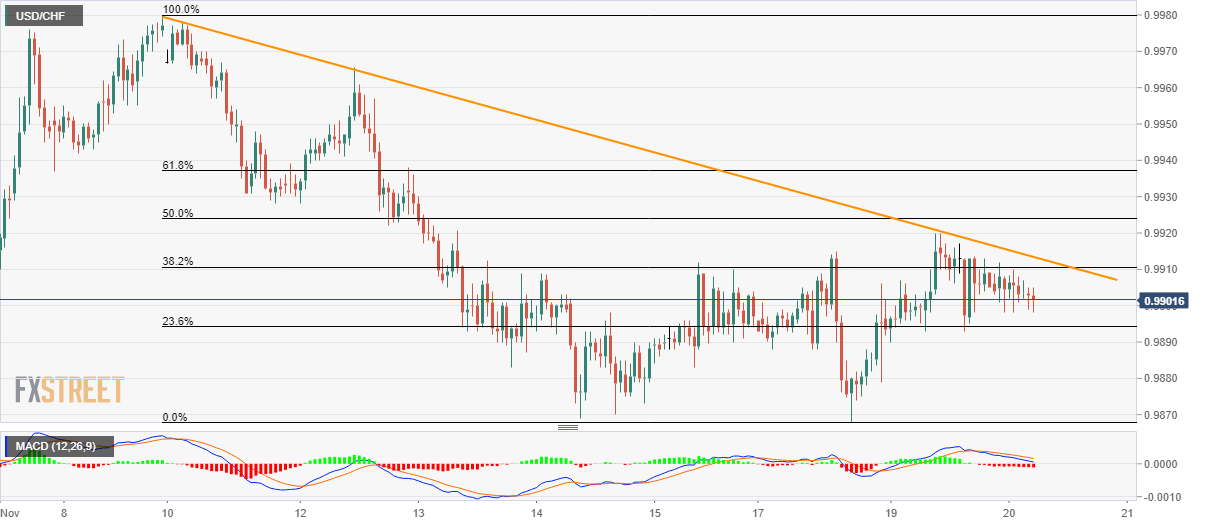
Trend: Bearish
