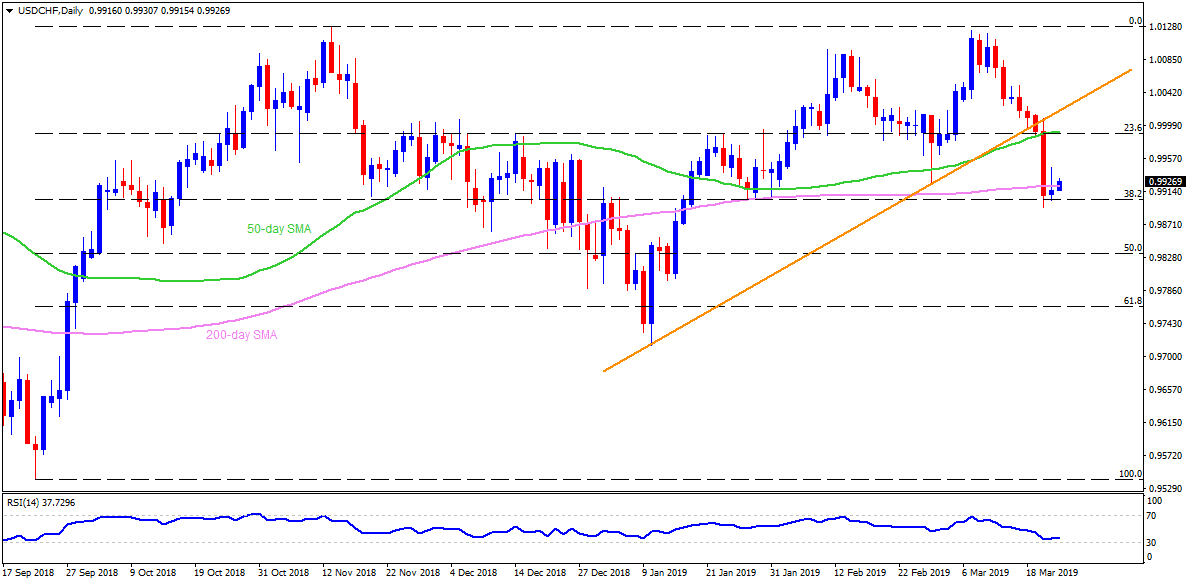
USD/CHF daily chart The USD/CHF pair trades near 0.9930 at the early Asian session on Friday. The quote recently bounced off the 38.2% Fibonacci retracement of its September – November 2018 upside but is struggling around 200-day simple moving average (SMA) level of 0.9920. Should the pair successfully cross 0.9920, 0.9960 can act as immediate resistance ahead of highlighting 0.9990 confluence comprising 50-day SMA and 23.6% Fibonacci. During the pair’s additional rise above 0.9990, 1.000 round-figure and support-turned-resistance line around 1.0020 can challenge buyers targeting 1.0055. On the downside break of 0.9900 Fibonacci figure, 0.9855, 0.9800 and 0.9780 could please sellers before challenging them with 61.8% Fibonacci retracement level of 0.9765. Additionally, 0.9700 and 0.9640 might become Bears’ favorites after 0.9765. 
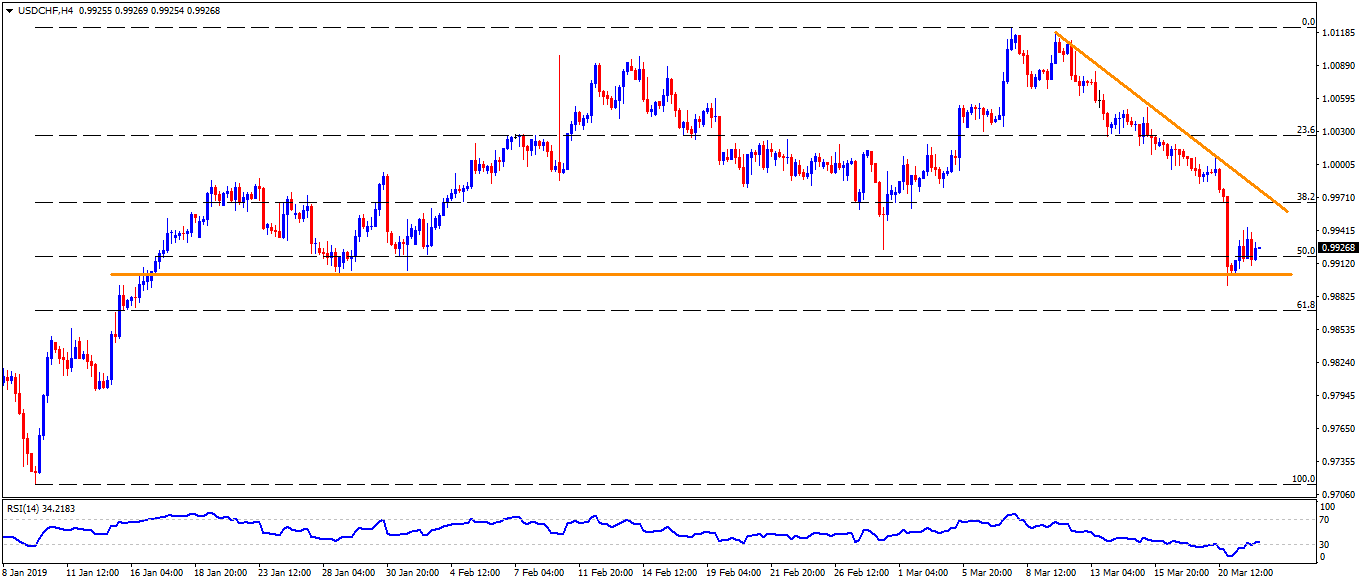
USD/CHF 4-Hour chart Short-term descending trend-line can offer intermediate resistance around 0.9980 between 0.9960 and 0.9990. 0.9820 may act as a buffer between 0.9855 and 0.9800. 
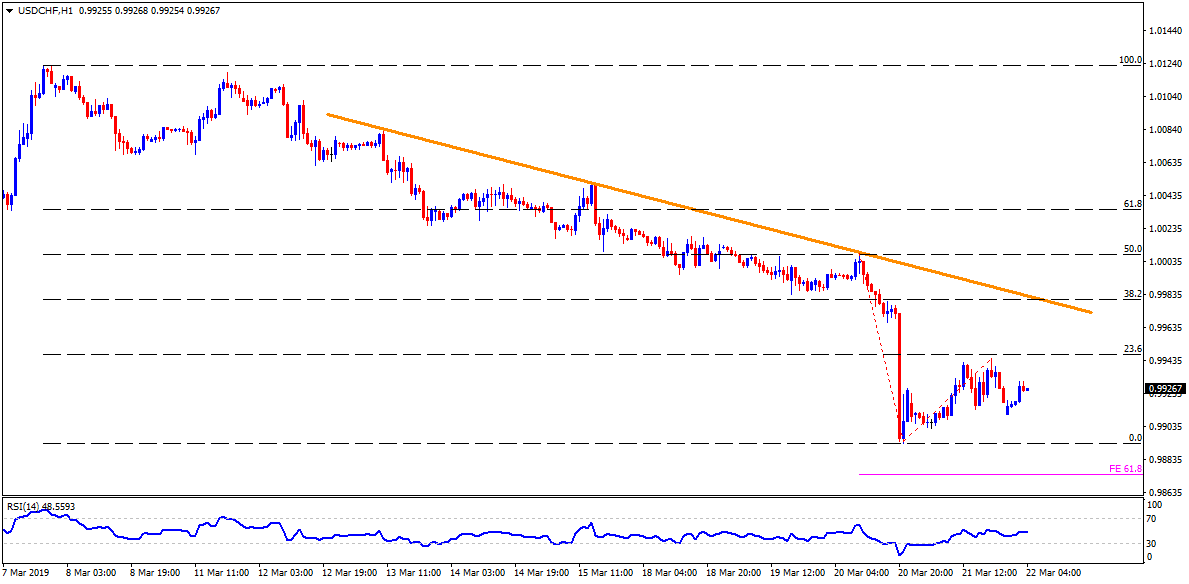
USD/CHF hourly chart Recent highs around 0.9945 could provide the closest resistance to the pair. Also, 61.8% Fibonacci expansion of moves from March 20, at 0.9875, might become adjacent support past-0.9900. FX Street FX Street FXStreet is the leading independent portal dedicated to the Foreign Exchange (Forex) market. It was launched in 2000 and the portal has always been proud of their unyielding commitment to provide objective and unbiased information, to enable their users to take better and more confident decisions. View All Post By FX Street FXStreet News share Read Next AUD/USD flirts with lows near 0.7100 amid fresh trade worries, risk-off FX Street 4 years USD/CHF daily chart The USD/CHF pair trades near 0.9930 at the early Asian session on Friday. The quote recently bounced off the 38.2% Fibonacci retracement of its September - November 2018 upside but is struggling around 200-day simple moving average (SMA) level of 0.9920. Should the pair successfully cross 0.9920, 0.9960 can act as immediate resistance ahead of highlighting 0.9990 confluence comprising 50-day SMA and 23.6% Fibonacci. During the pair's additional rise above 0.9990, 1.000 round-figure and support-turned-resistance line around 1.0020 can challenge buyers targeting 1.0055. On the downside break of 0.9900 Fibonacci figure, 0.9855, 0.9800 and 0.9780 could please… Regulated Forex Brokers All Brokers Sponsored Brokers Broker Benefits Min Deposit Score Visit Broker 1 $100T&Cs Apply 0% Commission and No stamp DutyRegulated by US,UK & International StockCopy Successfull Traders 9.8 Visit Site FreeBets Reviews$100Your capital is at risk. 2 T&Cs Apply 9.8 Visit Site FreeBets Reviews$100Your capital is at risk. 3 Recommended Broker $100T&Cs Apply No deposit or withdrawal feesTrade major forex pairs such as EUR/USD with leverage up to 30:1 and tight spreads of 0.9 pips Low $100 minimum deposit to open a trading account 9 Visit Site FreeBets ReviewsYour capital is at risk. 4 T&Cs Apply Visit Site FreeBets ReviewsYour capital is at risk. 5 Recommended Broker $0T&Cs Apply Trade gold, silver, and platinum directly against major currenciesUp to 1:500 leverage for forex trading24/5 customer service by phone and email 9 Visit Site FreeBets ReviewsYour capital is at risk.