- USD/CHF is starting the week by trading inside last Friday’s range as the pair keeps compressing in a triangle pattern on the daily chart.
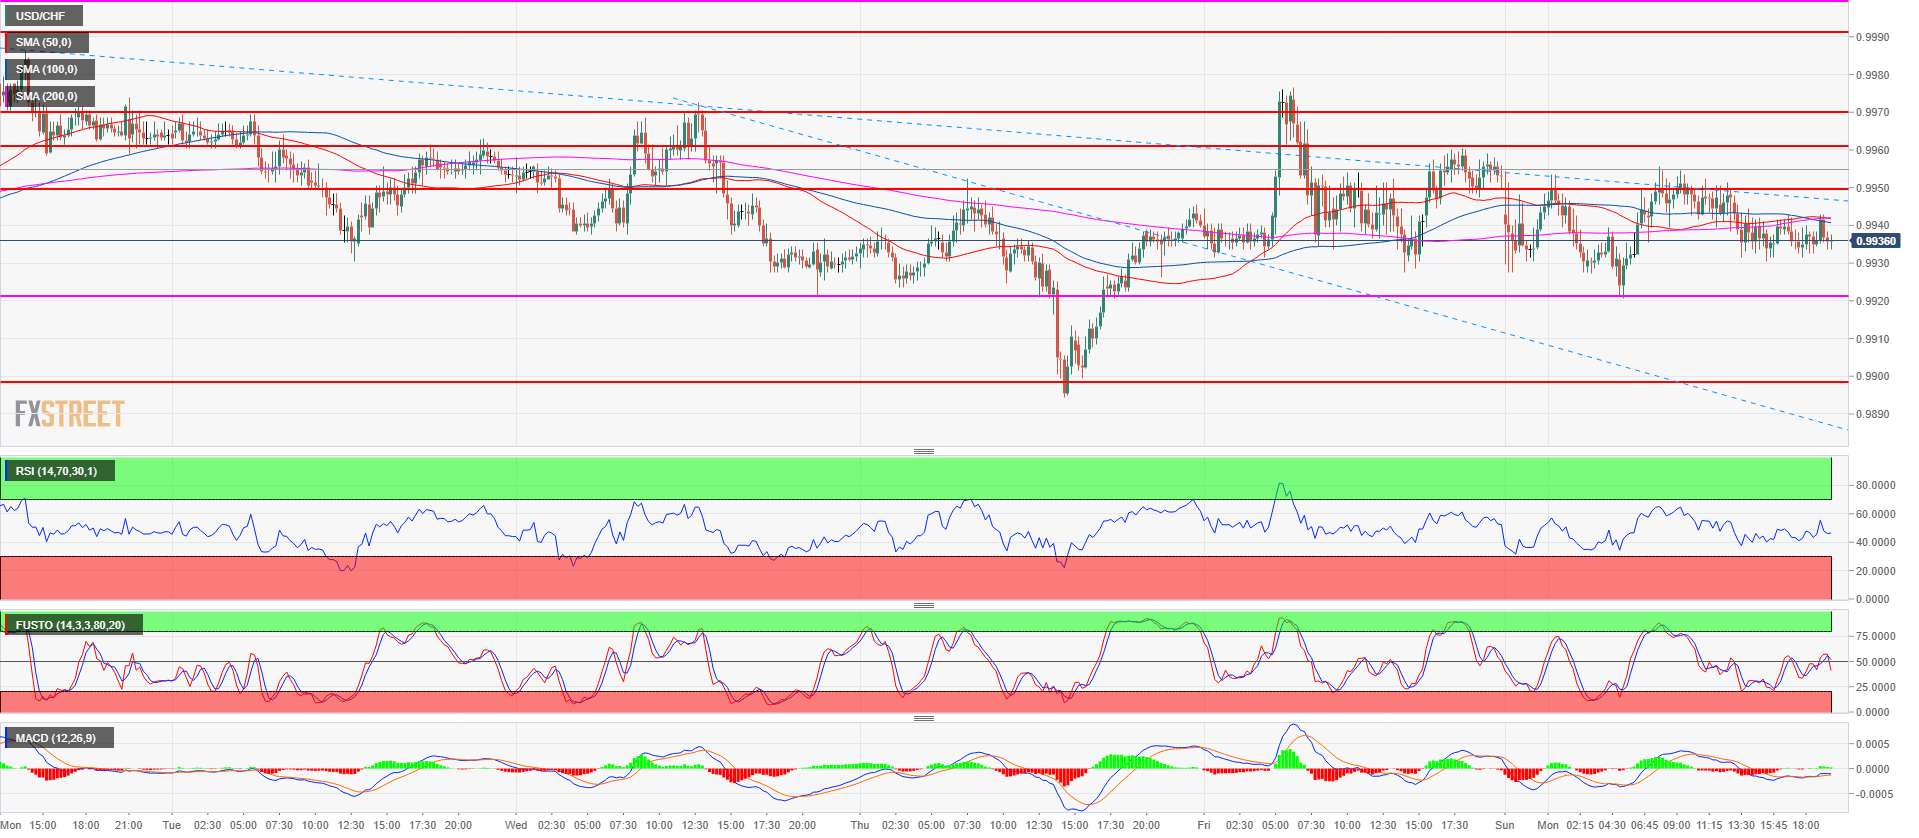
- USD/CHF is trading above its main daily simple moving averages (50, 100 and 200-period) suggesting that the main trend keeps a bullish bias for the time being. In the short-term, the 0.9920 and 0.9900 are the main supports while to the upside the 0.9960-0.9970 area and 0.9989-1.0000 zone remain strong resistances.
- A strong bullish breakout above 1.0000 is most likely needed to unlock the satus-quo.
USD/CHF daily chart
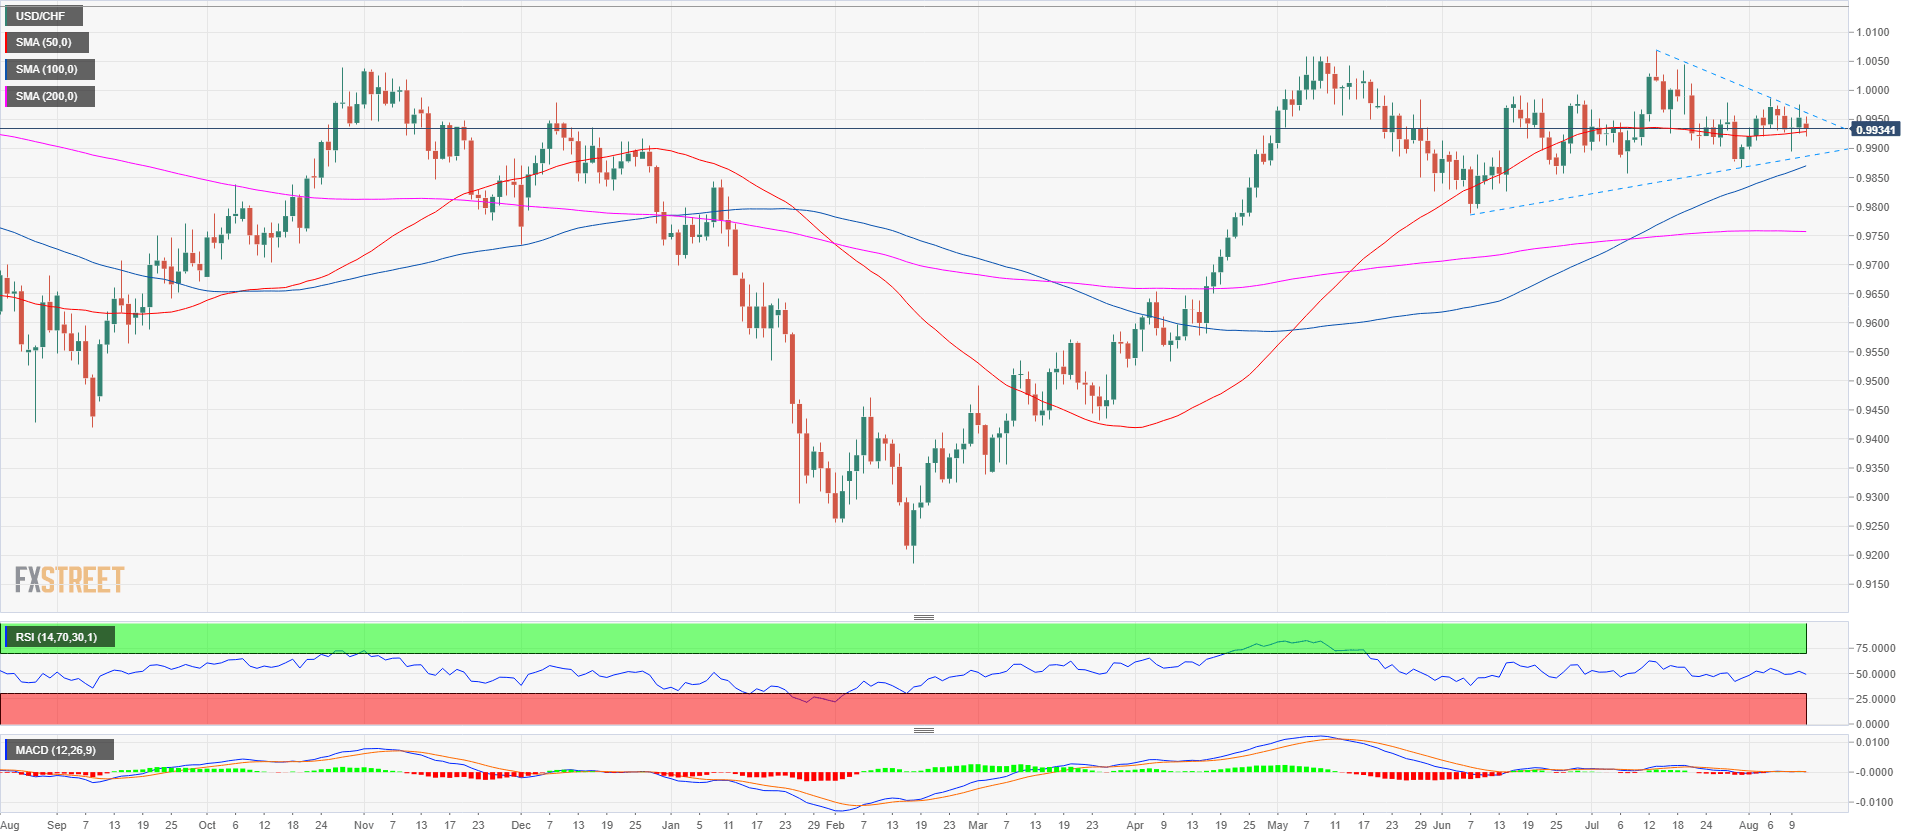
Spot rate: 0.9933
Relative change: -0.20%
High: 0.9955
Low: 0.9920
Trend: Bullish
Resistance 1: 0.9950 figure
Resistance 2: 0.9960-0.9970 area, supply level and July 27 high
Resistance 3: 0.9989-1.0000 area, June 15 high and parity
Resistance 4: 1.0043-1.0069 area, July 19 high and current 2018 high
Resistance 5: 1.0170 March 7, 2017 high
Resistance 6: 1.0343 December 15, 2016
Support 1: 0.9920 August 3 low
Support 2: 0.9867 July 31 low
Support 3: 0.9856 June 25 low
Support 4: 0.9788 June 7 swing low
