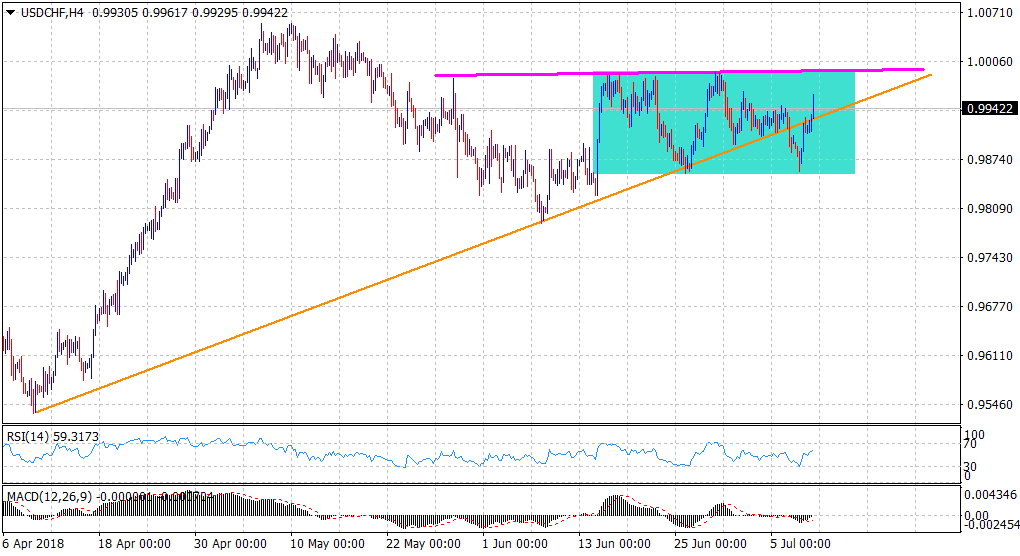
“¢ The pair rebounds from late-May swing lows support near the 0.9855 region and now seems to have formed a rectangle chart pattern on the 4-hourly chart.
“¢ Mixed short-term technical indicators on the mentioned chart further add credence to the consolidative trading range.
“¢ Meanwhile, last week’s break below ascending trend-line support points to a bearish set-up and hence, the trading range resistance might continue to cap any subsequent up-move.
Spot rate: 0.9942
Daily High: 0.9962
Daily Low: 0.9910
Trend: Sideways
Resistance
R1: 0.9962 (current day swing high)
R2: 0.9993 (June monthly tops)
R3: 1.0019 (R3 daily pivot-point)
Support
S1: 0.9917 (100-period SMA H1)
S2: 0.9900 (round figure mark)
S3: 0.9871 (S1 daily pivot-point)
