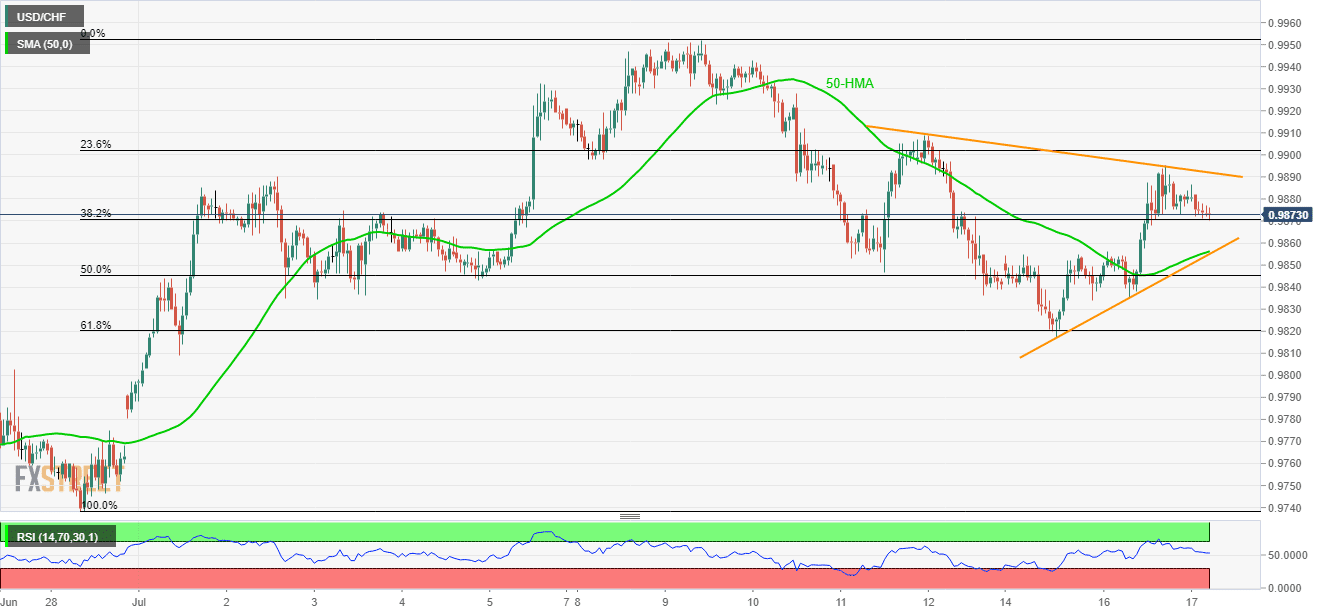
- 4-day old symmetrical triangle limits USD/CHF moves between 23.6% and 61.8% Fibonacci retracement levels.
- 50-HMA strengthens the triangle support.
Following immediate symmetrical triangle chart pattern, the USD/CHF pair takes the rounds to 0.9874 ahead of the Europe markets open on Wednesday.
While 38.2% Fibonacci retracement of late-June to early July upside, at 0.9870, acts as immediate support, pair’s further downside could be restricted by 0.9857/55 support confluence including 50-hour moving average (HMA) and support-line of the triangle pattern.
In a case where prices slip beneath 0.9855, 61.8% Fibonacci retracement level of 0.9820 can offer an intermediate halt to its downpour targeting sun-0.9800 area.
Alternatively, the pair’s upside clearance of 0.9892 formation resistance level can quickly flash 0.9910 on the chart.
However, current month high around 0.9952 and 1.0000 psychological magnet could question buyers afterward.
USD/CHF hourly chart
Trend: Sideways
