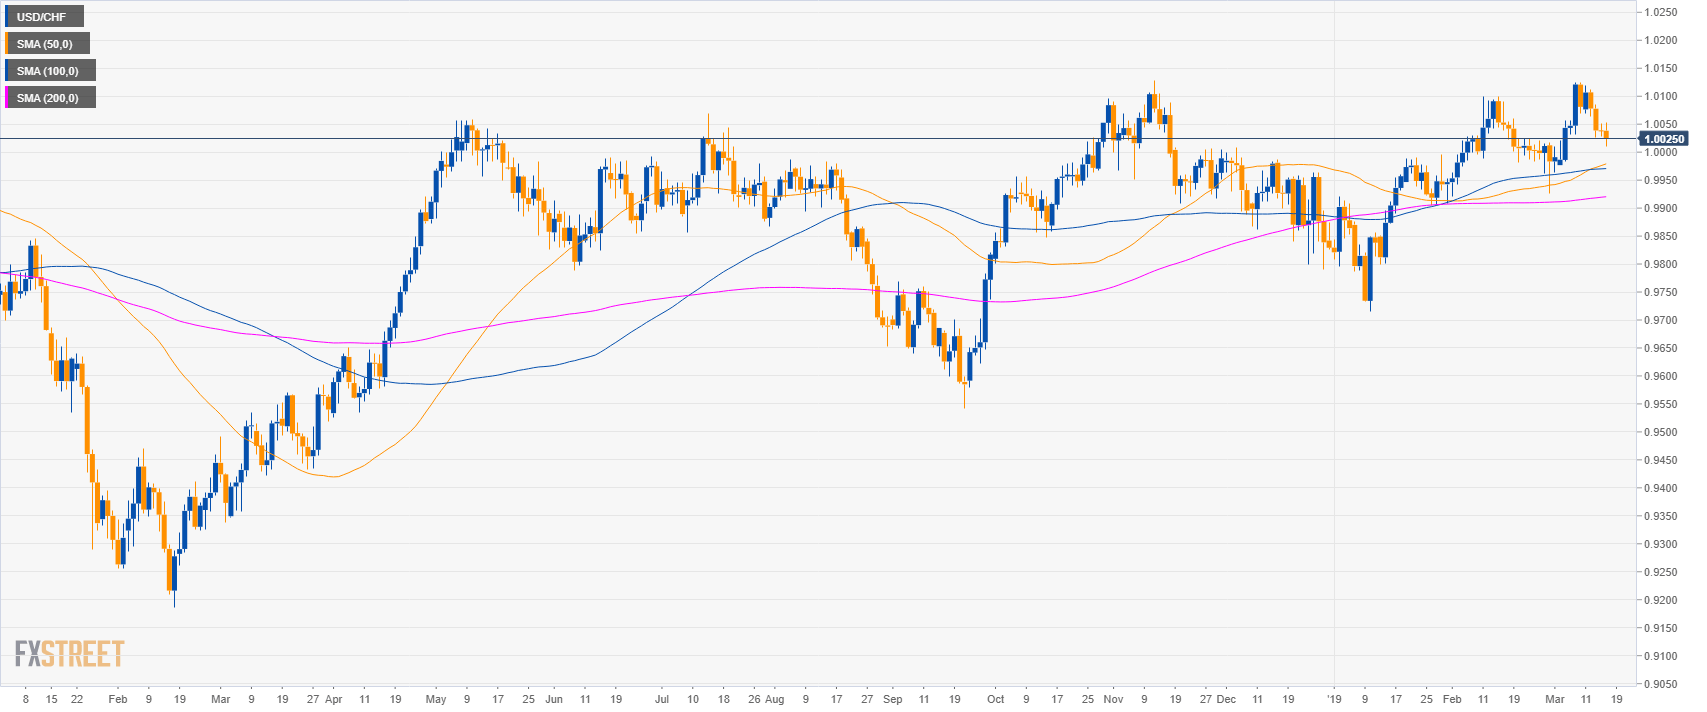
USD/CHF daily chart
- USD/CHF is trading in a bull trend above its main simple moving averages (SMAs).
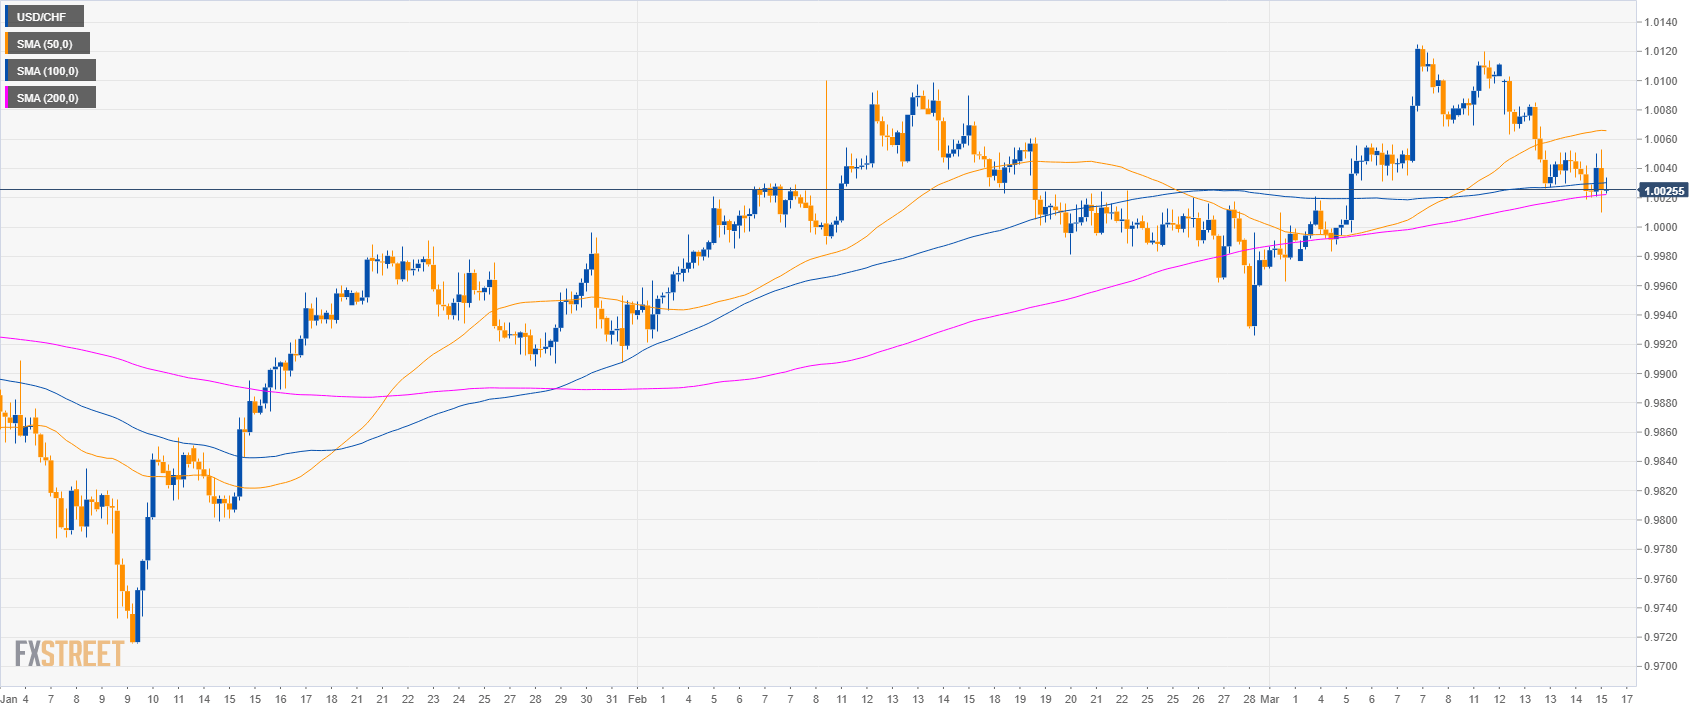
USD/CHF 4-hour chart
- USD/CHF is trading between the 50 and 200 SMAs suggesting a consolidation in the medium-term.
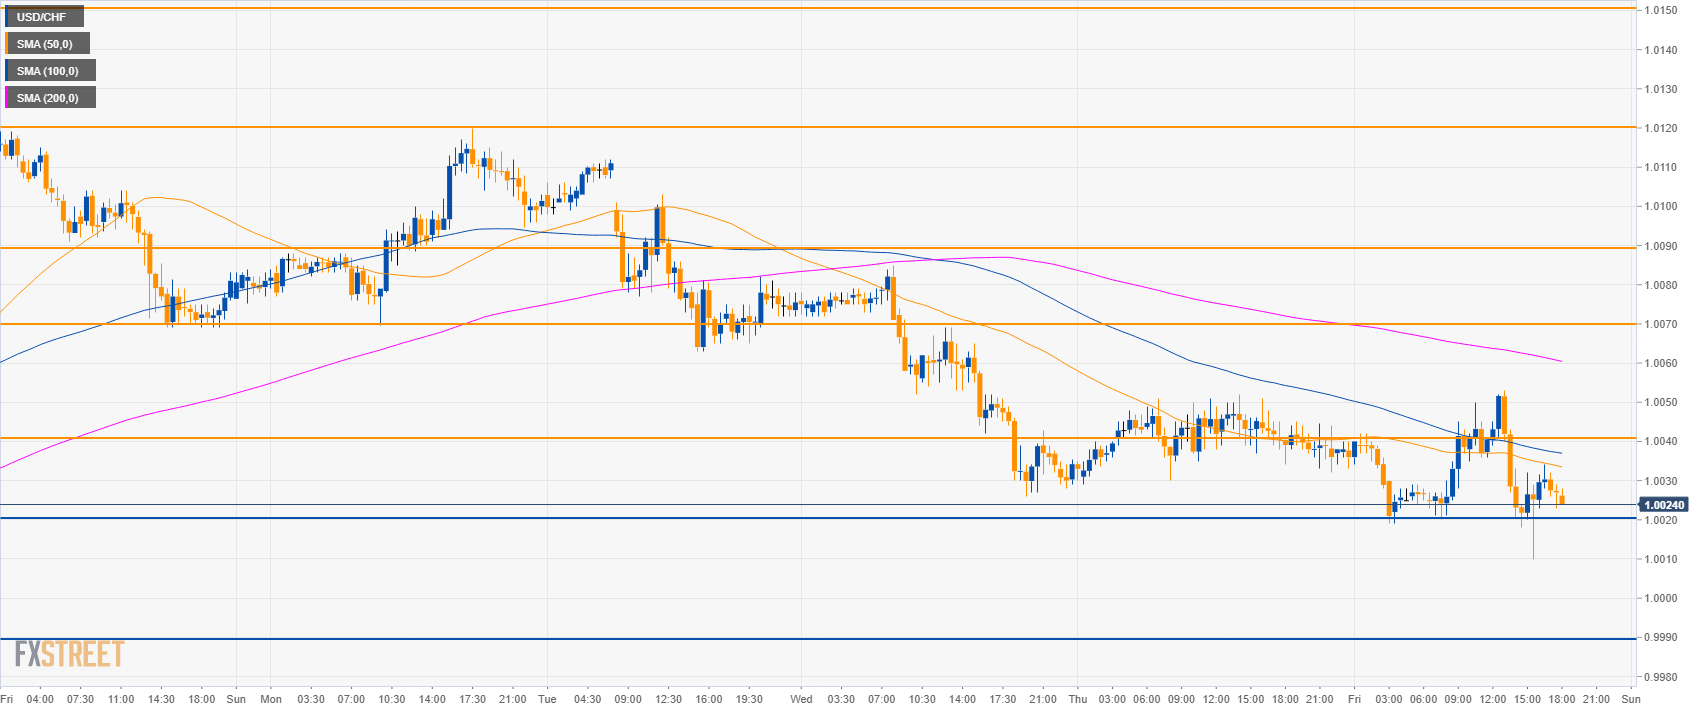
USD/CHF 30-minute chart
- USD/CHF is trading below its main SMAs suggesting a bearish bias in the short-term.
- A break below 1.0020 can lead to 0.9990 support.
- To the upside, resistances are at 1.0040 and 1.0070 level.
Additional key levels
USD/CHF
Overview:
Today Last Price: 1.0027
Today Daily change: -11 pips
Today Daily change %: -0.11%
Today Daily Open: 1.0038
Trends:
Daily SMA20: 1.0032
Daily SMA50: 0.9976
Daily SMA100: 0.997
Daily SMA200: 0.992
Levels:
Previous Daily High: 1.0052
Previous Daily Low: 1.0028
Previous Weekly High: 1.0125
Previous Weekly Low: 0.9977
Previous Monthly High: 1.01
Previous Monthly Low: 0.9921
Daily Fibonacci 38.2%: 1.0037
Daily Fibonacci 61.8%: 1.0043
Daily Pivot Point S1: 1.0027
Daily Pivot Point S2: 1.0015
Daily Pivot Point S3: 1.0003
Daily Pivot Point R1: 1.0051
Daily Pivot Point R2: 1.0063
Daily Pivot Point R3: 1.0075
