- USD/CHF is in a bull trend above the 200-period simple moving average on the 4-hour chart.
- USD/CHF broke above the parity level and look set to close the day above it. The nest target is likely located near 1.0068 July 13 high.
- Below the parity level supports to the downside are likely located near 0.9950 and 0.9891 October 4 low.
USD/CHF 4-hour chart
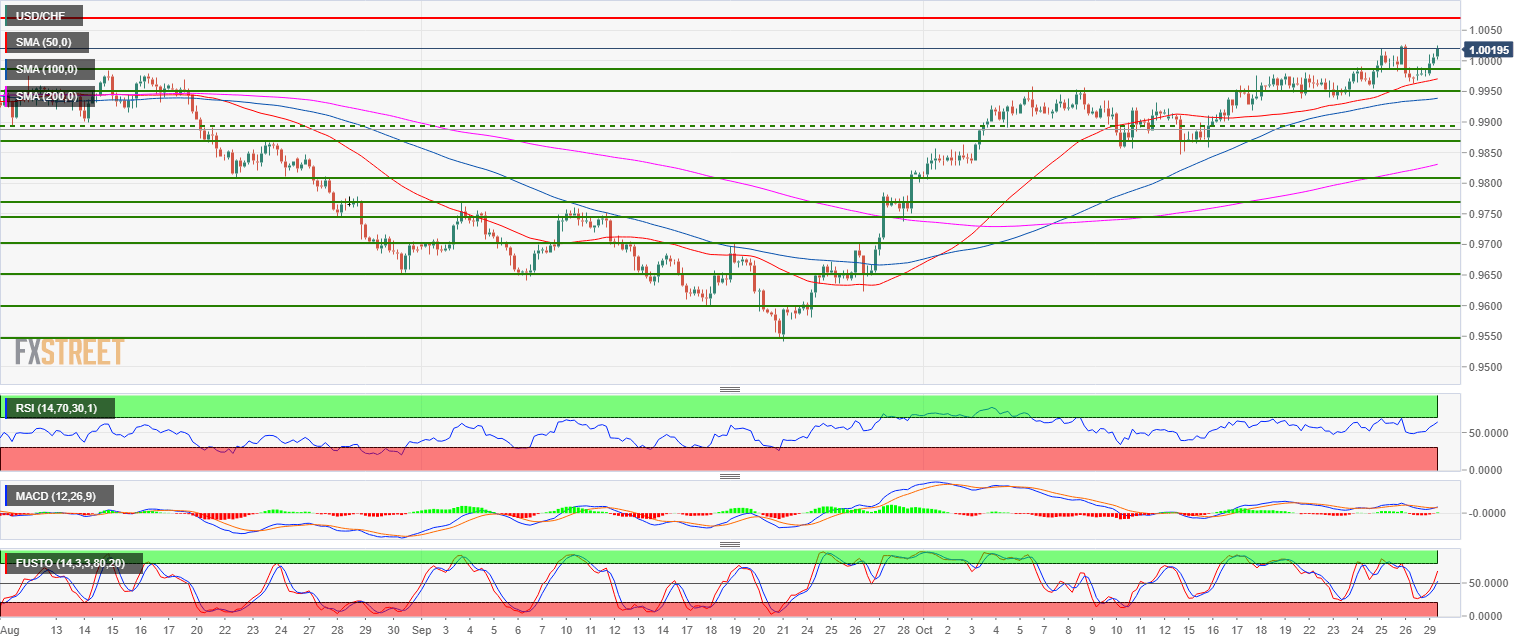
Main trend: Bullish
Resistance 1: 1.0068 July 13 high
Resistance 2: 1.0100 figure
Resistance 3: 1.0160 March 2017 high
Support 1: 1.0000 parity level
Support 2: 0.9986 August high
Support 3: 0.9950 figure
Support 4: 0.9891 October 4 low
Support 5: 0.9868 July 31 low
Additional key levels at a glance
USD/CHF
Overview:
Last Price: 1.0023
Daily change: 51 pips
Daily change: 0.511%
Daily Open: 0.9972
Trends:
Daily SMA20: 0.9925
Daily SMA50: 0.9803
Daily SMA100: 0.987
Daily SMA200: 0.9748
Levels:
Daily High: 1.0028
Daily Low: 0.9964
Weekly High: 1.0028
Weekly Low: 0.9938
Monthly High: 0.982
Monthly Low: 0.9542
Daily Fibonacci 38.2%: 0.9988
Daily Fibonacci 61.8%: 1.0003
Daily Pivot Point S1: 0.9948
Daily Pivot Point S2: 0.9924
Daily Pivot Point S3: 0.9884
Daily Pivot Point R1: 1.0012
Daily Pivot Point R2: 1.0052
Daily Pivot Point R3: 1.0076
