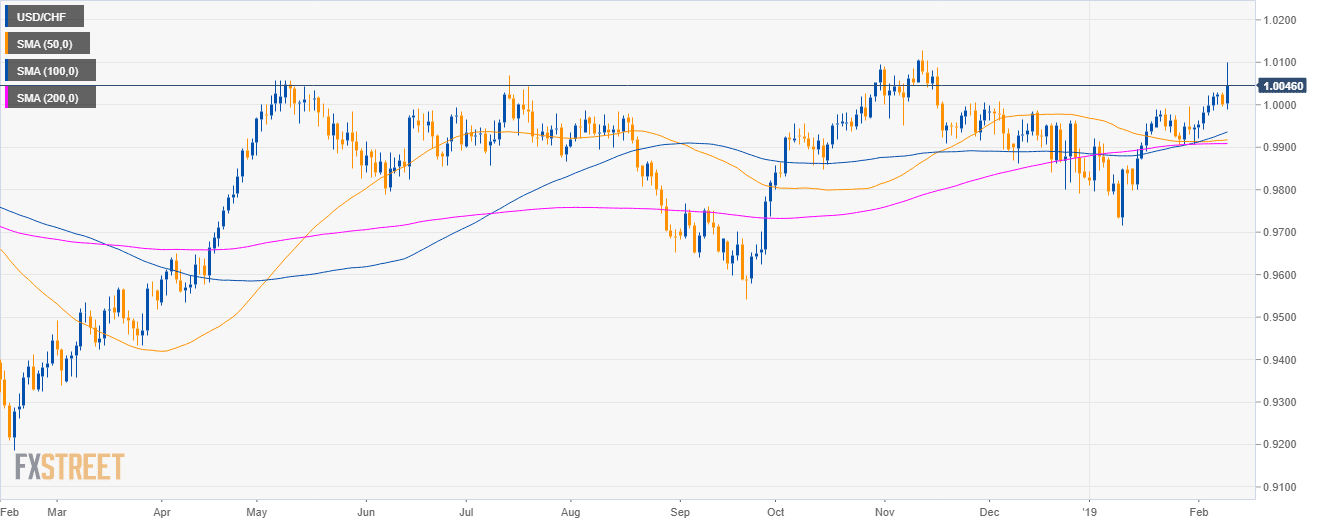
USD/CHF daily chart
- USD/CHF is trading in a sideways trend above the 50, 100 and 200-day simple moving averages (SMAs).
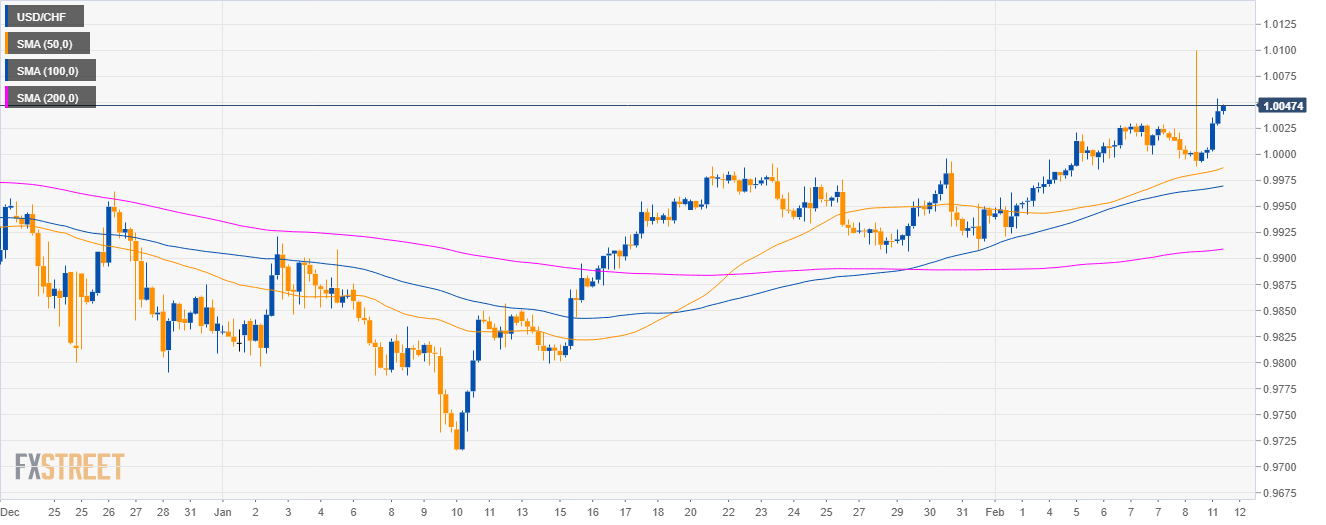
USD/CHF 4-hour chart
- USD/CHF is trading above its main SMAs suggesting bullish momentum in the medium-term.
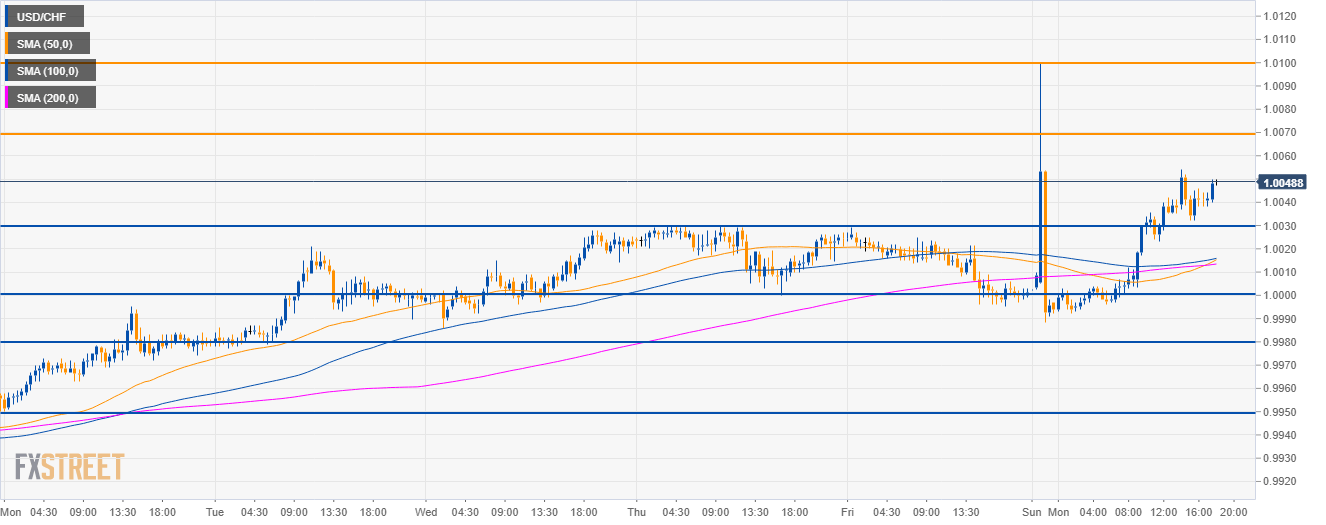
USD/CHF 30-minute chart
- USD/CHF is evolving above its main SMAs suggesting bullish momentum.
- Resistances are seen at the 1.0070 and 1.100 level.
- On the way down, support is seen at 1.0030 and 1.0000 levels
Additional key levels
USD/CHF
Overview:
Today Last Price: 1.0048
Today Daily change: 47 pips
Today Daily change %: 0.47%
Today Daily Open: 1.0001
Trends:
Daily SMA20: 0.995
Daily SMA50: 0.9916
Daily SMA100: 0.9932
Daily SMA200: 0.9908
Levels:
Previous Daily High: 1.0029
Previous Daily Low: 0.9995
Previous Weekly High: 1.003
Previous Weekly Low: 0.9943
Previous Monthly High: 0.9996
Previous Monthly Low: 0.9716
Daily Fibonacci 38.2%: 1.0008
Daily Fibonacci 61.8%: 1.0016
Daily Pivot Point S1: 0.9988
Daily Pivot Point S2: 0.9974
Daily Pivot Point S3: 0.9954
Daily Pivot Point R1: 1.0022
Daily Pivot Point R2: 1.0042
Daily Pivot Point R3: 1.0056
