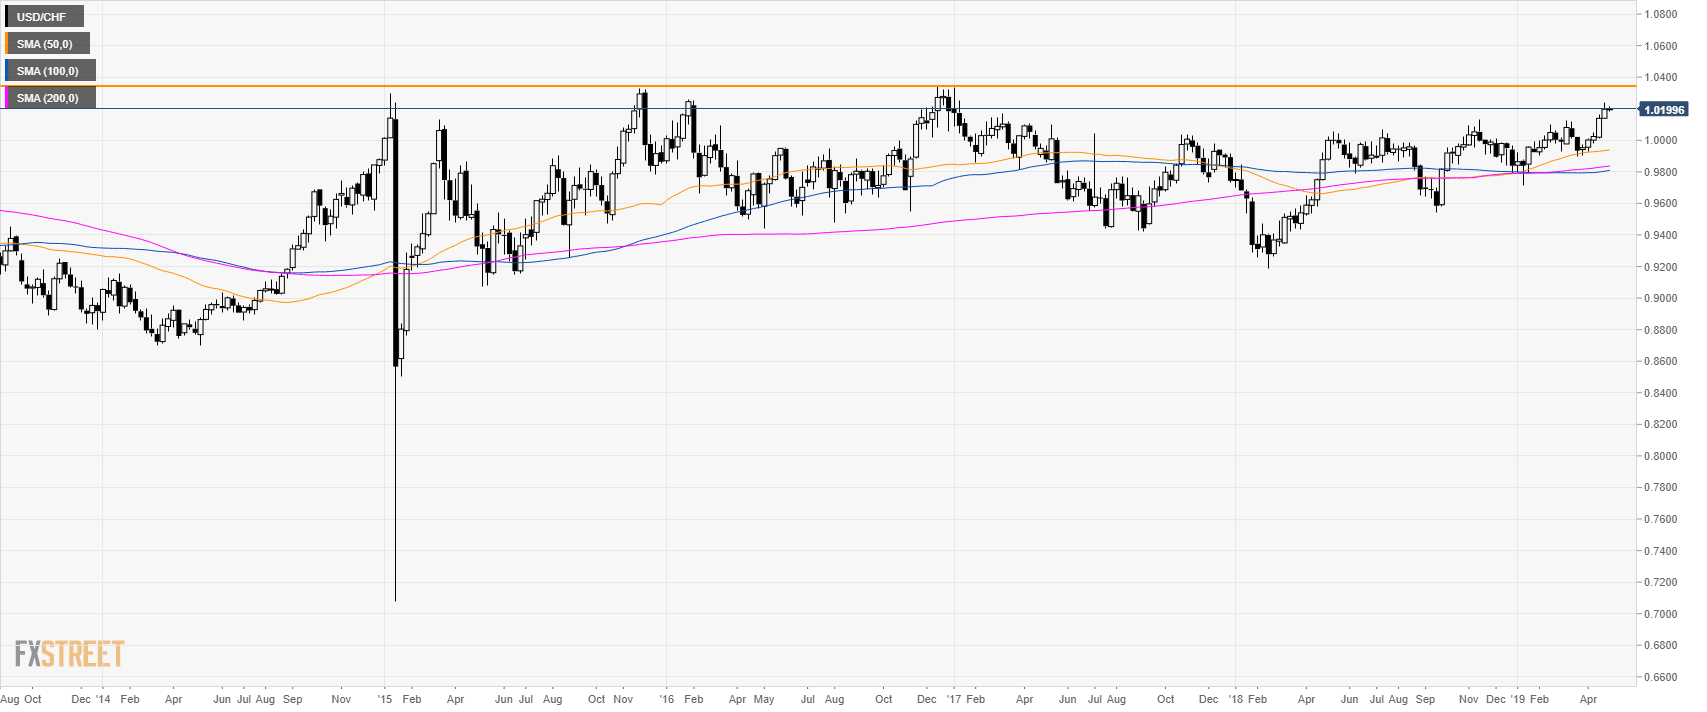
USD/CHF monthly chart
- USD/CHF is trading at its highest level since January 2017.
- USD/CHF is trading above its main monthly simple moving avearges (SMAs).
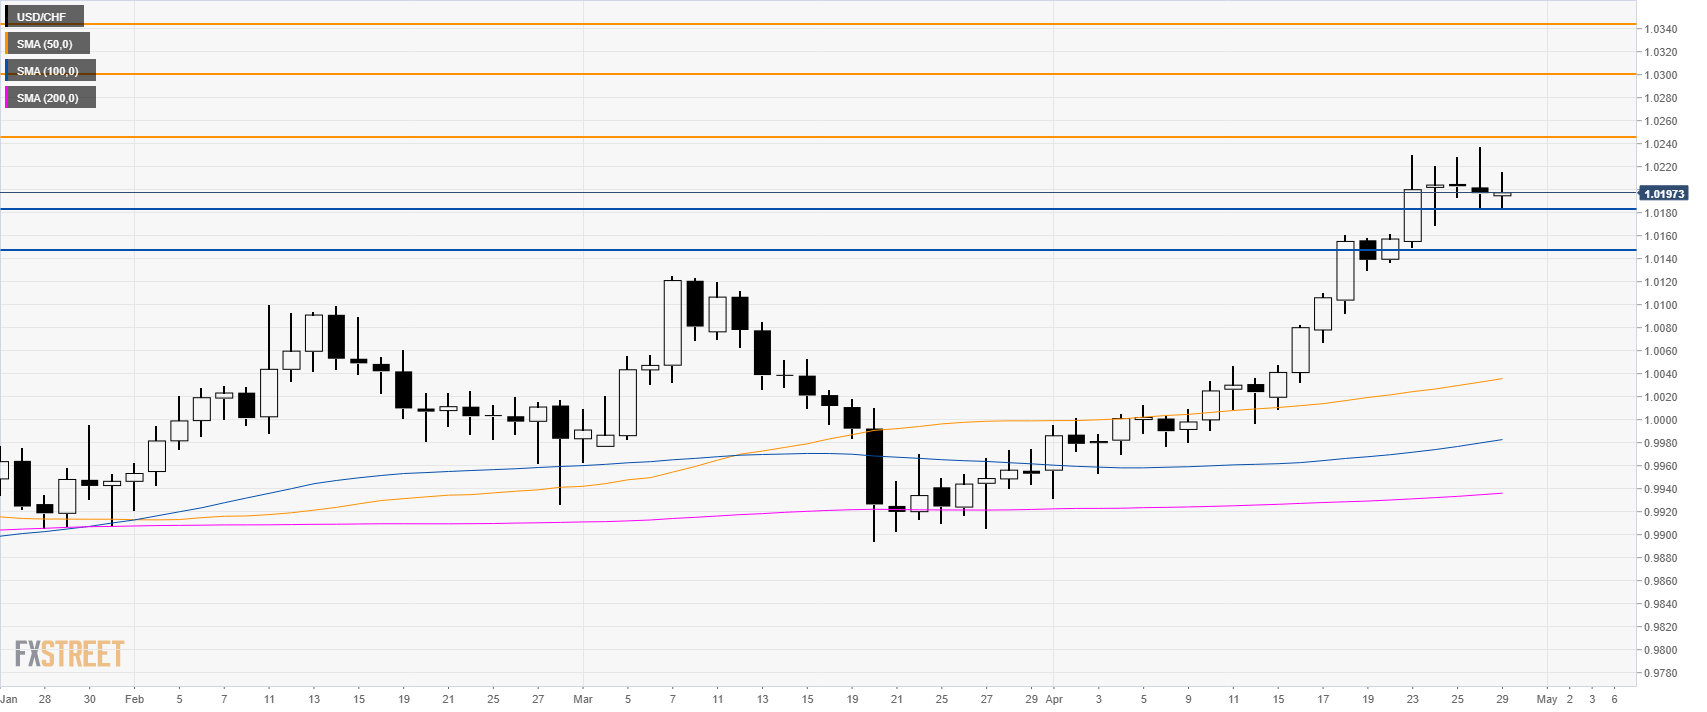
USD/CHF daily chart
- The trend is bullish as the market trades above its main SMAs.
- If bulls overcome 1.0250 resistance then 1.0300 figure and 1.0344, multi-month resistance can come into play.
- Support is currently seen at 1.0184 and 1.0150 level.
Additional key levels
