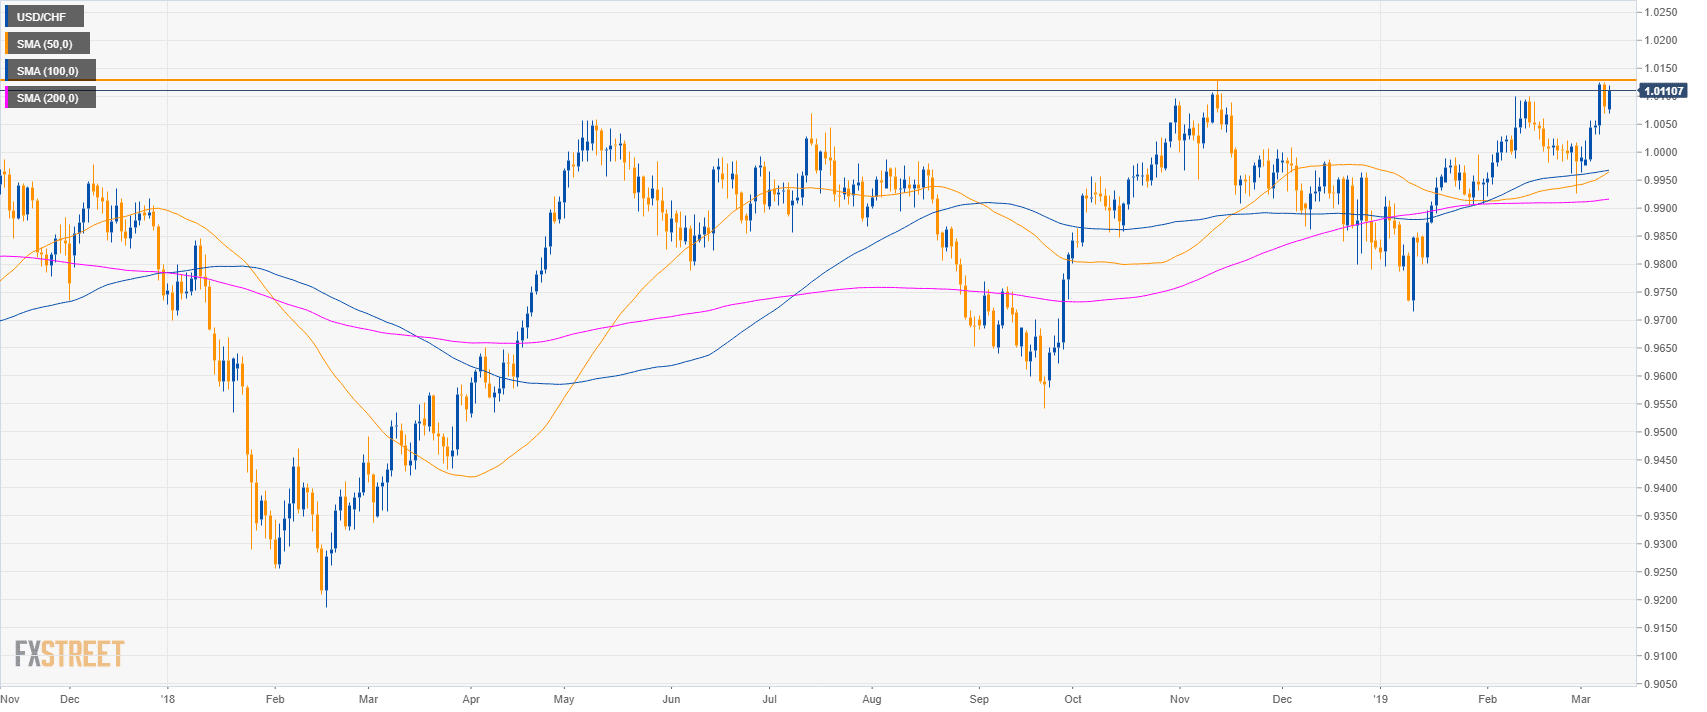
USD/CHF daily chart
- USD/CHF is trading in a sideways trend above its main simple moving averages (SMAs).
- The market is very close to the 2018 high.
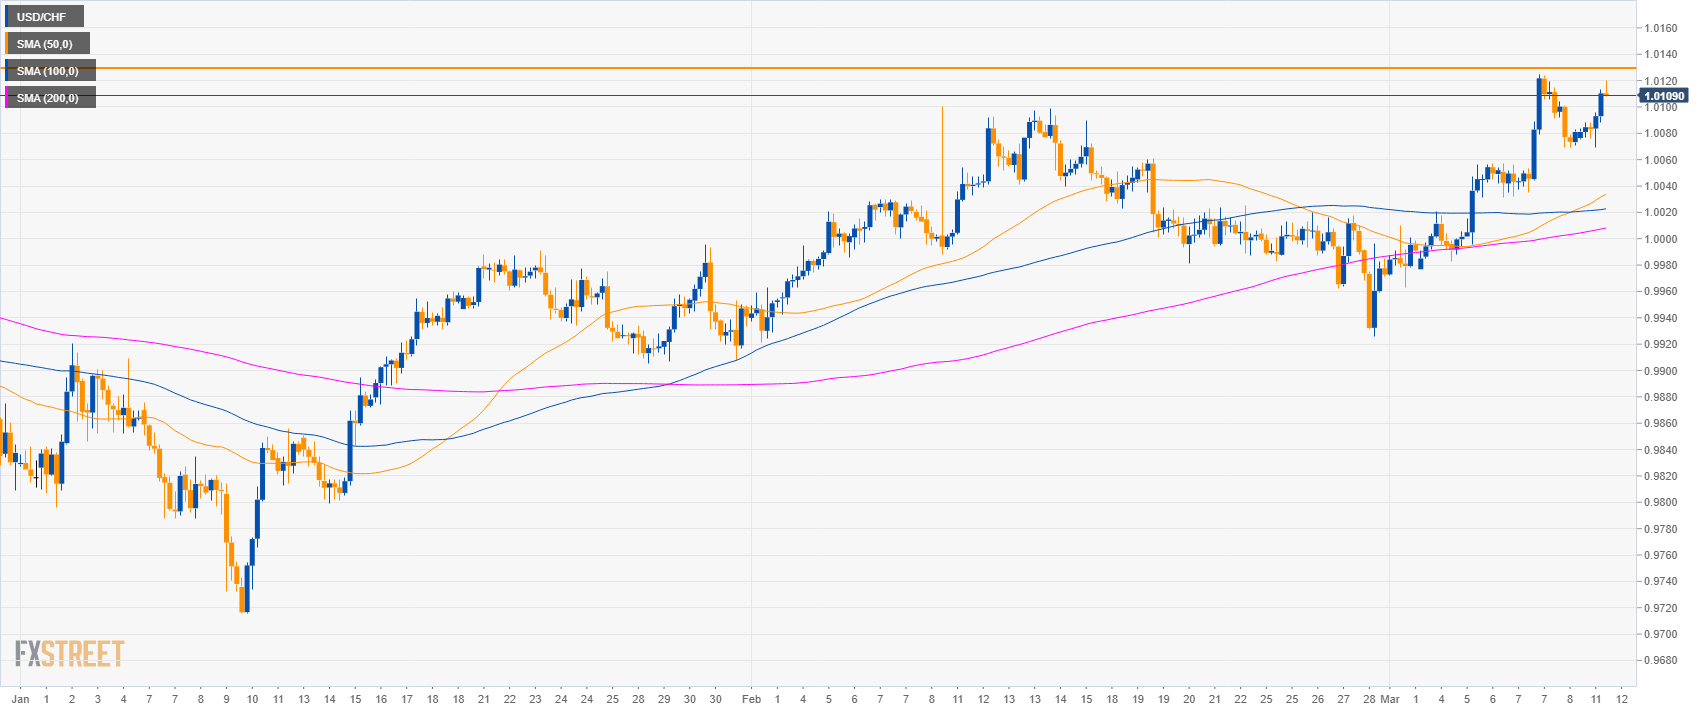
USD/CHF 4-hour chart
- USD/CHF is trading above its main SMAs suggesting bullish momentum in the medium-term.
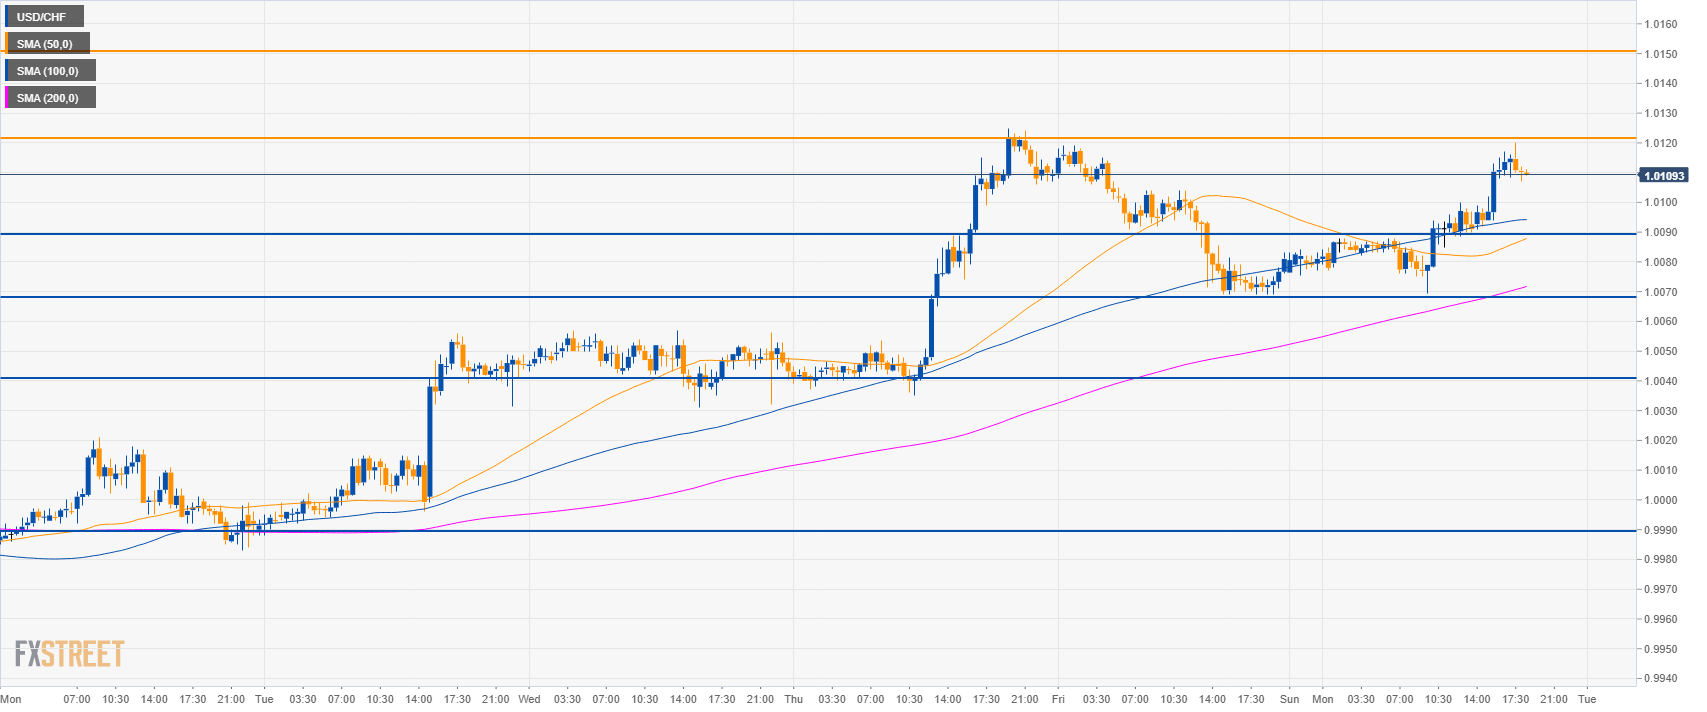
USD/CHF 30-minute chart
- USD/CHF is trading above its main SMAs suggesting a bullish bias
- A break above 1.0120 can lead to 1.0150 resistance.
- To the downside, supports are seen near 1.0090 and 1.0070 level.
Additional key levels
USD/CHF
Overview:
Today Last Price: 1.011
Today Daily change: 29 pips
Today Daily change %: 0.29%
Today Daily Open: 1.0081
Trends:
Daily SMA20: 1.0032
Daily SMA50: 0.9959
Daily SMA100: 0.9966
Daily SMA200: 0.9915
Levels:
Previous Daily High: 1.0124
Previous Daily Low: 1.0069
Previous Weekly High: 1.0125
Previous Weekly Low: 0.9977
Previous Monthly High: 1.01
Previous Monthly Low: 0.9921
Daily Fibonacci 38.2%: 1.009
Daily Fibonacci 61.8%: 1.0103
Daily Pivot Point S1: 1.0059
Daily Pivot Point S2: 1.0036
Daily Pivot Point S3: 1.0004
Daily Pivot Point R1: 1.0114
Daily Pivot Point R2: 1.0146
Daily Pivot Point R3: 1.0169
