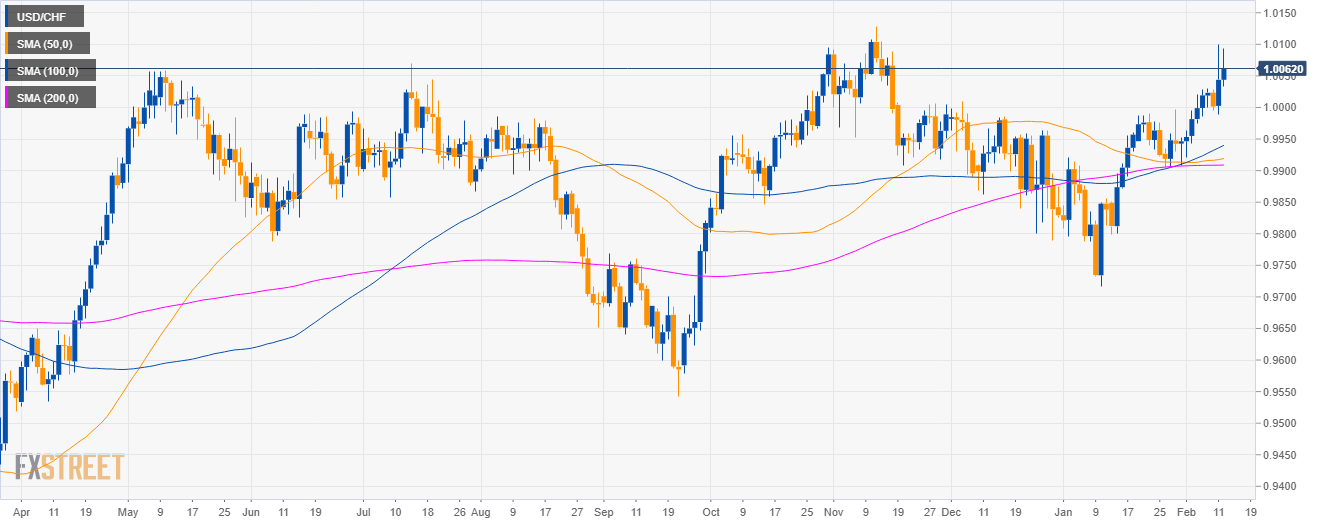
USD/CHF daily chart
- USD/CHF is trading in a sideways trend above the 50, 100 and 200-day simple moving averages (SMAs).
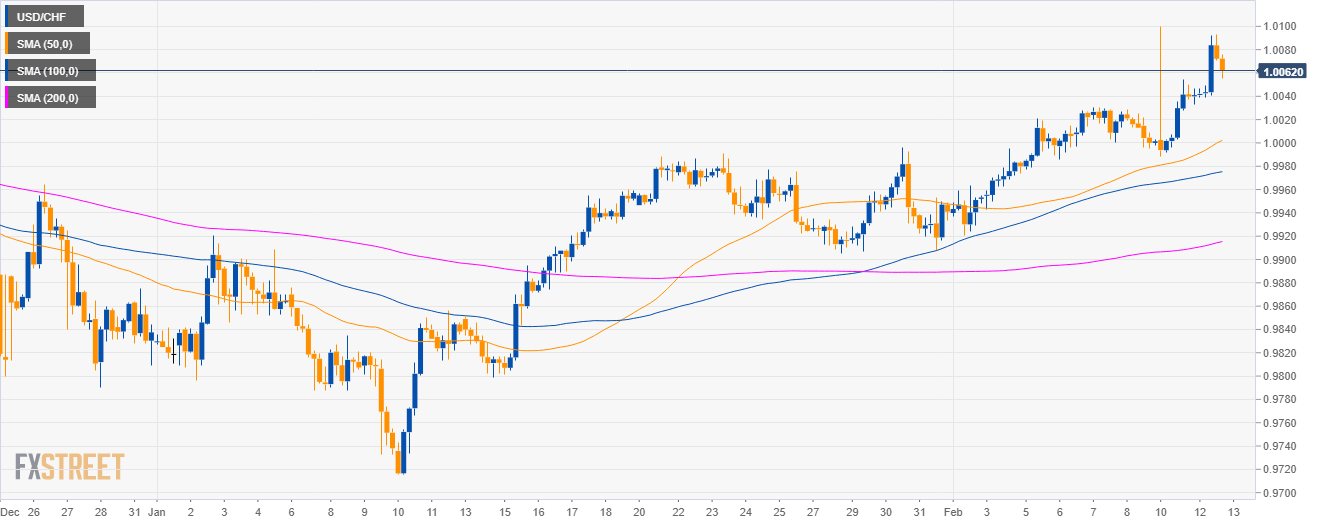
USD/CHF 4-hour chart
- USD/CHF is trading above its main SMAs suggesting bullish momentum in the medium-term.
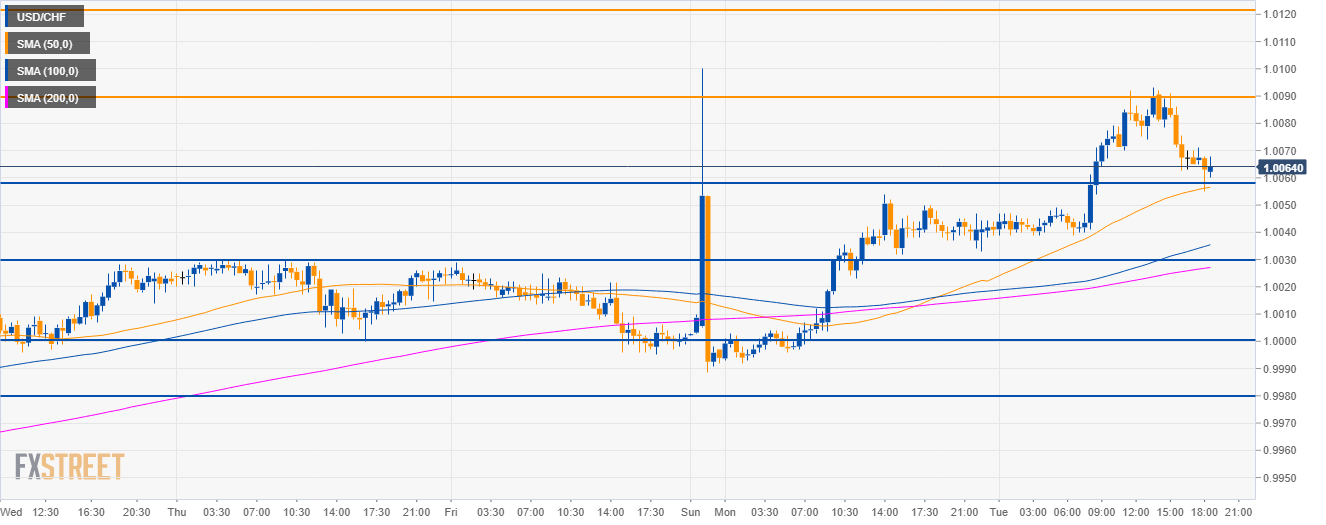
USD/CHF 30-minute chart
- USD/CHF is evolving above its main SMAs suggesting bullish momentum as the bulls are trying to find some support at the 50 SMA and the 1.0060 level.
- Bulls will try to continue the upmove to reclaim 1.0090 and reach 1.0120 to the upside.
- On the way down, support is seen at 1.0060 and 1.0030 levels.
Additional key levels
USD/CHF
Overview:
Today Last Price: 1.0064
Today Daily change: 20 pips
Today Daily change %: 0.20%
Today Daily Open: 1.0044
Trends:
Daily SMA20: 0.9962
Daily SMA50: 0.9917
Daily SMA100: 0.9936
Daily SMA200: 0.9909
Levels:
Previous Daily High: 1.01
Previous Daily Low: 0.9988
Previous Weekly High: 1.003
Previous Weekly Low: 0.9943
Previous Monthly High: 0.9996
Previous Monthly Low: 0.9716
Daily Fibonacci 38.2%: 1.0058
Daily Fibonacci 61.8%: 1.0031
Daily Pivot Point S1: 0.9988
Daily Pivot Point S2: 0.9932
Daily Pivot Point S3: 0.9876
Daily Pivot Point R1: 1.01
Daily Pivot Point R2: 1.0156
Daily Pivot Point R3: 1.0212
