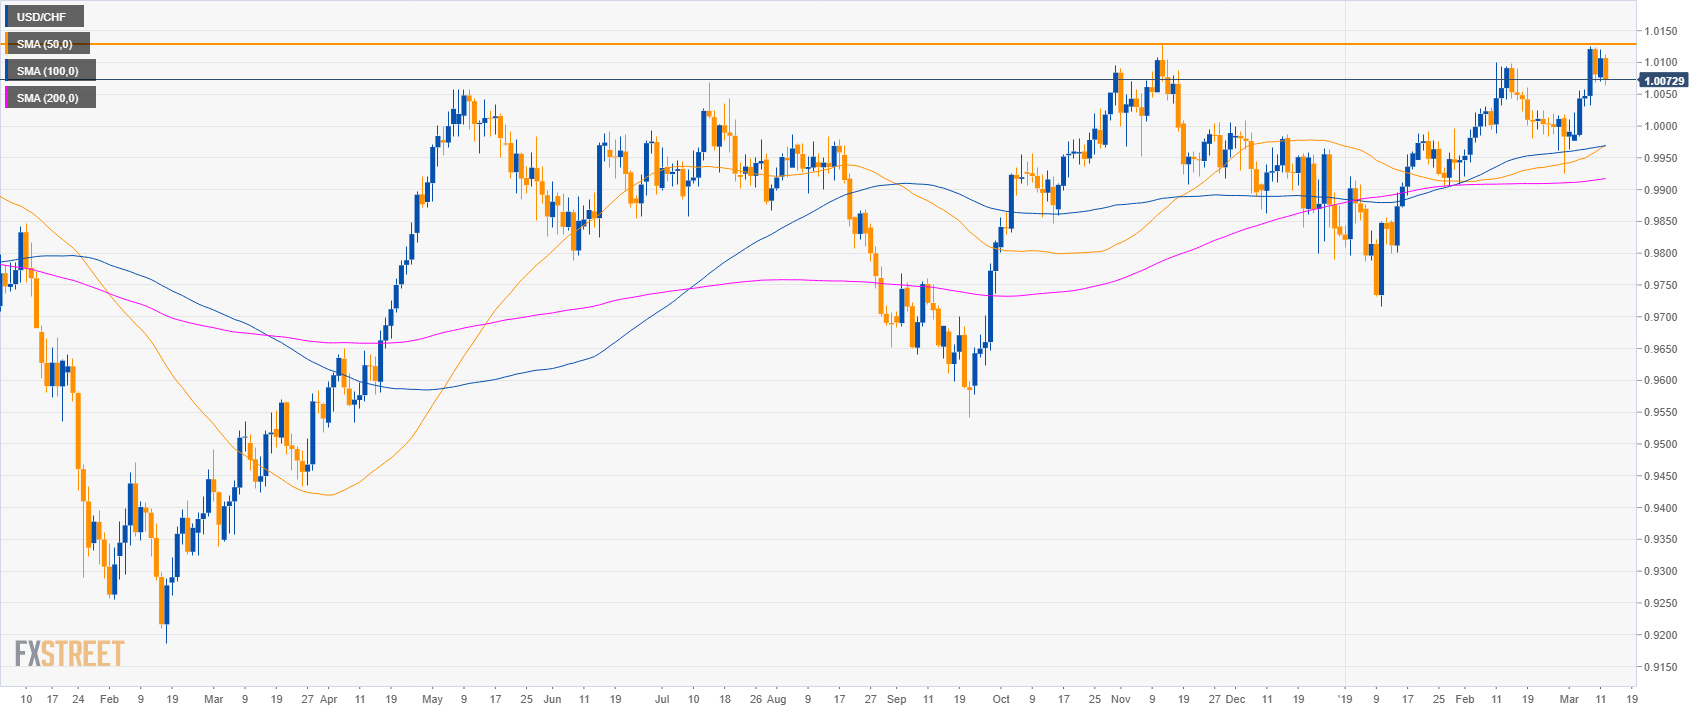
USD/CHF daily chart
- USD/CHF is trading in a sideways trend between the 50 and 200-day simple moving averages (SMAs).
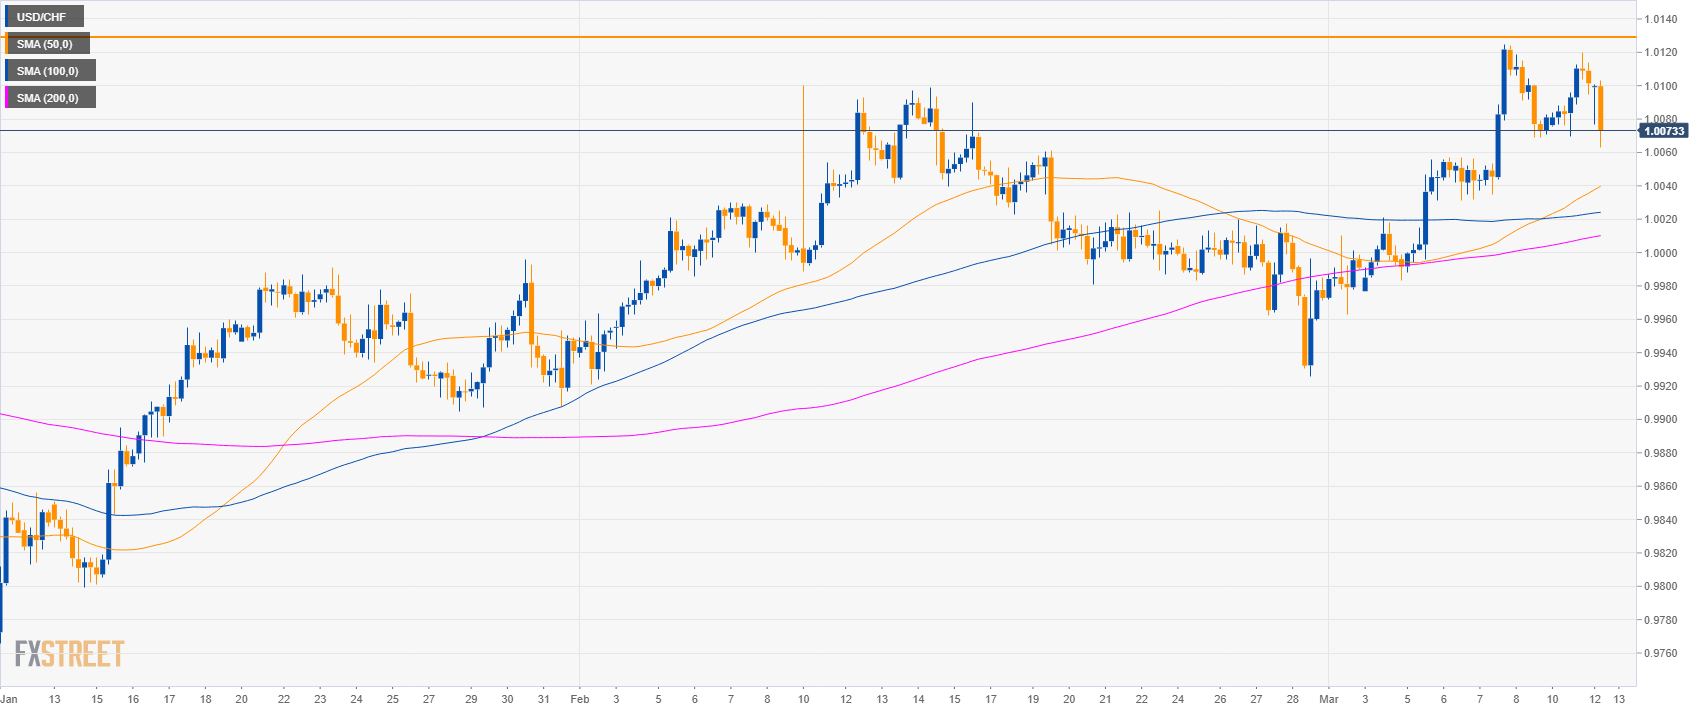
USD/CHF 4-hour chart
- USD/CHF is trading above its main SMAs suggesting bullish momentum in the medium-term.
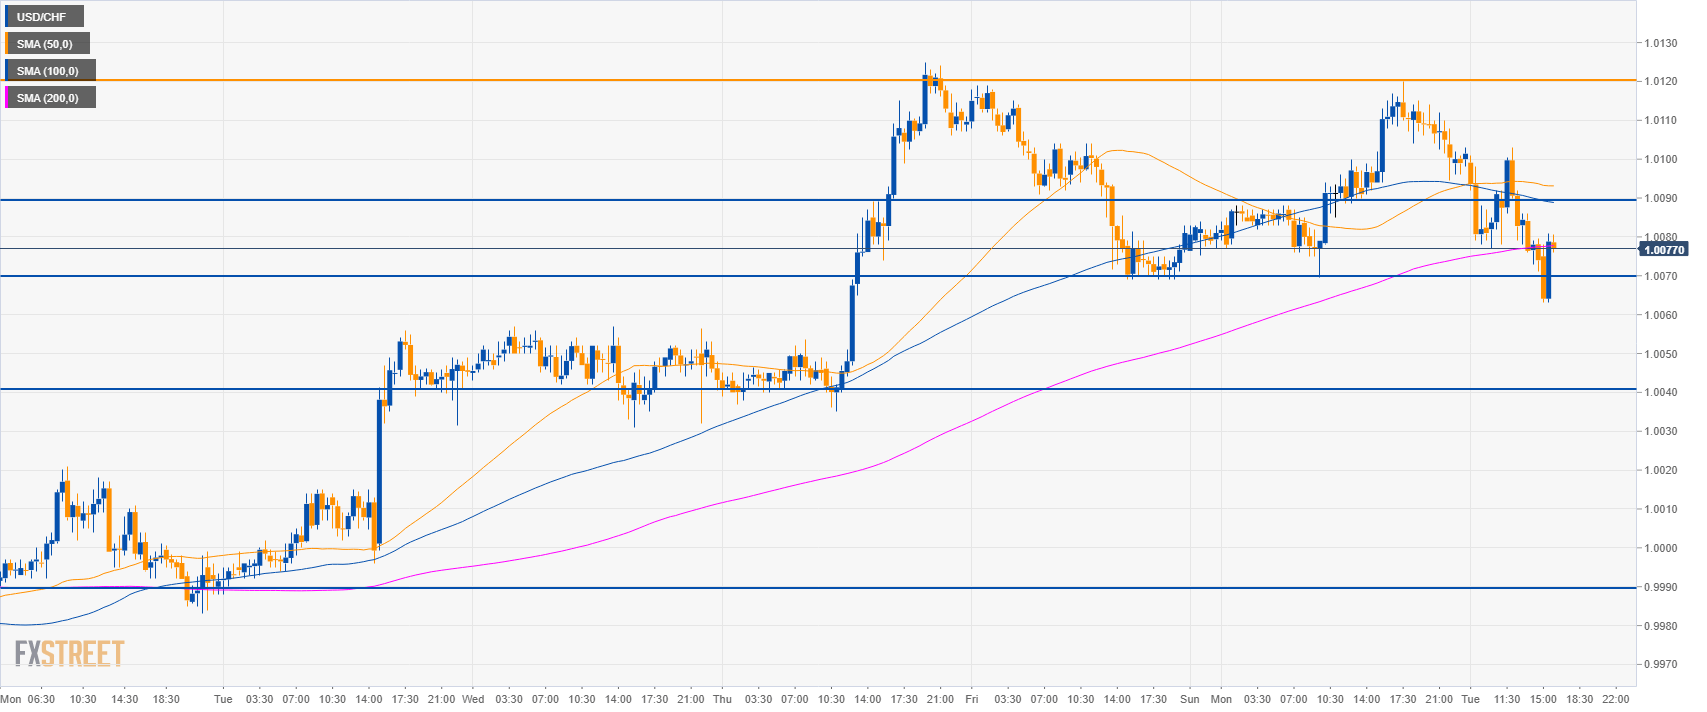
USD/CHF 30-minute chart
- USD/CHF is trading below the 50 and 100 SMAs suggesting a weakening bull trend.
- A break above 1.0070 can lead to 1.0040 and 0.9990 support.
- To the upside, resistances are seen near 1.0090 and 1.0120 level.
Additional key levels
USD/CHF
Overview:
Today Last Price: 1.0079
Today Daily change: -28 pips
Today Daily change %: -0.28%
Today Daily Open: 1.0107
Trends:
Daily SMA20: 1.0035
Daily SMA50: 0.9965
Daily SMA100: 0.9968
Daily SMA200: 0.9916
Levels:
Previous Daily High: 1.012
Previous Daily Low: 1.007
Previous Weekly High: 1.0125
Previous Weekly Low: 0.9977
Previous Monthly High: 1.01
Previous Monthly Low: 0.9921
Daily Fibonacci 38.2%: 1.0101
Daily Fibonacci 61.8%: 1.0089
Daily Pivot Point S1: 1.0077
Daily Pivot Point S2: 1.0048
Daily Pivot Point S3: 1.0027
Daily Pivot Point R1: 1.0128
Daily Pivot Point R2: 1.0149
Daily Pivot Point R3: 1.0178
