“¢ The pair built on the overnight bullish breakthrough one-month-old trading range, with persistent USD buying interest providing an additional boost on Friday.
“¢ Short-term technical indicators are gradually picking up the pace and remain supportive of an extension of the ongoing positive momentum.
“¢ Bulls might now be looking to test YTD tops, set in May, before eventually aiming to test 61.8% Fibonacci expansion level of the April-May upswing and subsequent retracement.
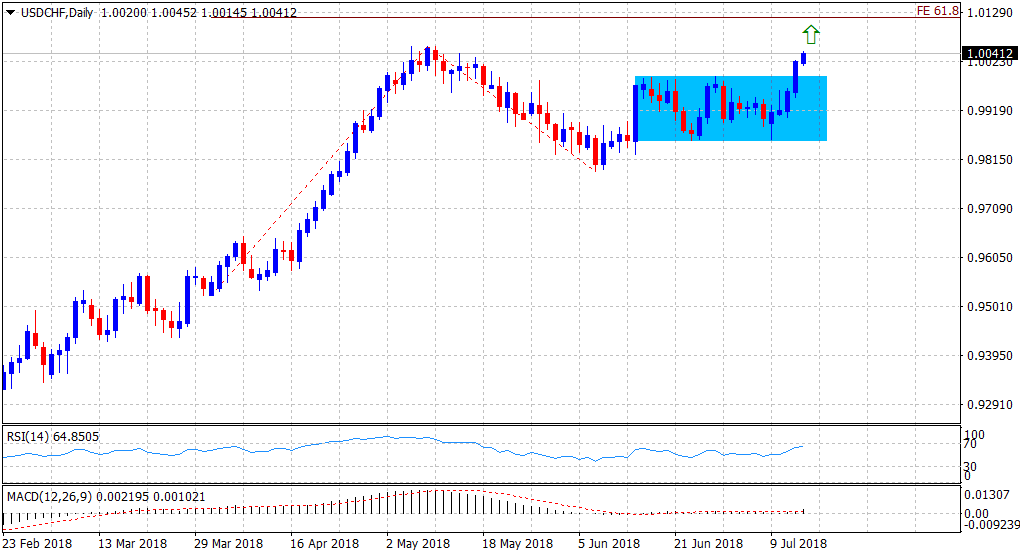
Spot rate: 1.0041
Daily Low: 1.0015
Trend: Bullish
Resistance
R1: 1.0057 (YTD tops set on May 10)
R2: 1.0082 (R2 daily pivot-point)
R3: 1.0117 (61.8% Fibo. expansion)
Support
S1: 1.0015 (current day swing low)
S2: 0.9990 (trading range resistance break-point)
S3: 0.9970 (S1 daily pivot-point)
