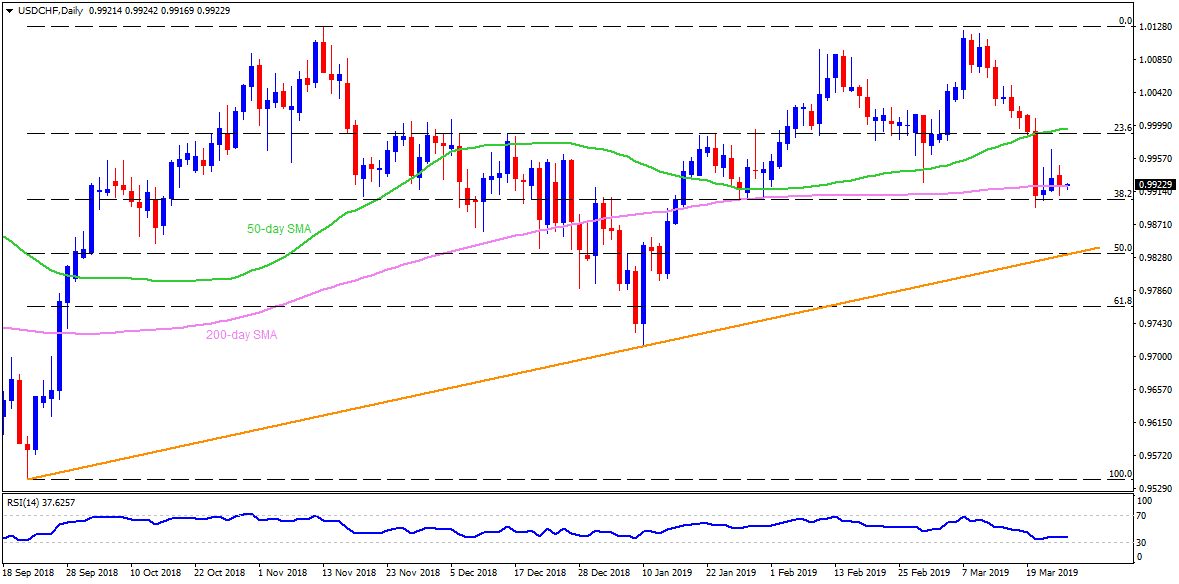
USD/CHF daily chart
- USD/CHF continues to remain around 200-day simple moving average (SMA) figure of 0.9920 ahead of European open on Tuesday.
- 38.2% Fibonacci retracement level of September to November 2018 rise, at 0.9900, seems immediate support for the pair ahead of looking towards 0.9860 and 0.9800 rest-points.
- On the upside, 0.9960 and 0.9990-1.000 area comprising 50-day SMA and 23.6% Fibonacci retracement could challenge buyers.
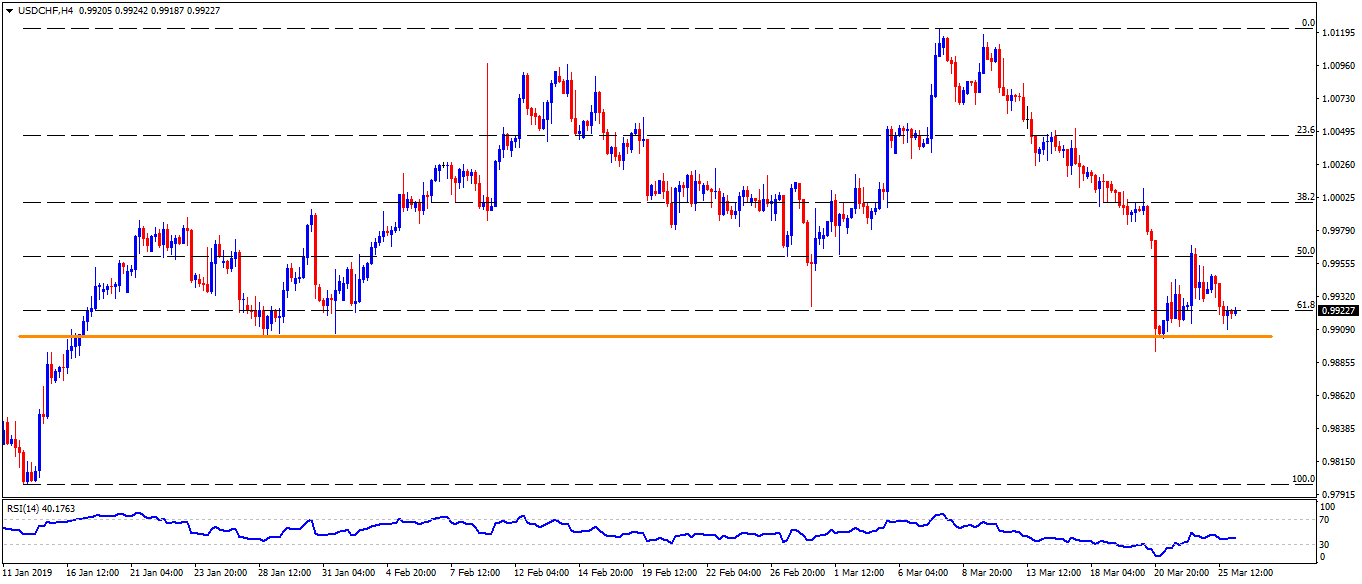
USD/CHF 4-Hour chart
- In addition to 38.2% FIbo, the horizontal line connecting late-January lows to the recent lows also highlights 0.9900 round-figure for sellers.
- 1.0025/30 and 1.0070 are likely resistances to watch past-1.0000 breakout.
- Also, 0.9840 may act as an intermediate halt between 0.9860 and 0.9800.
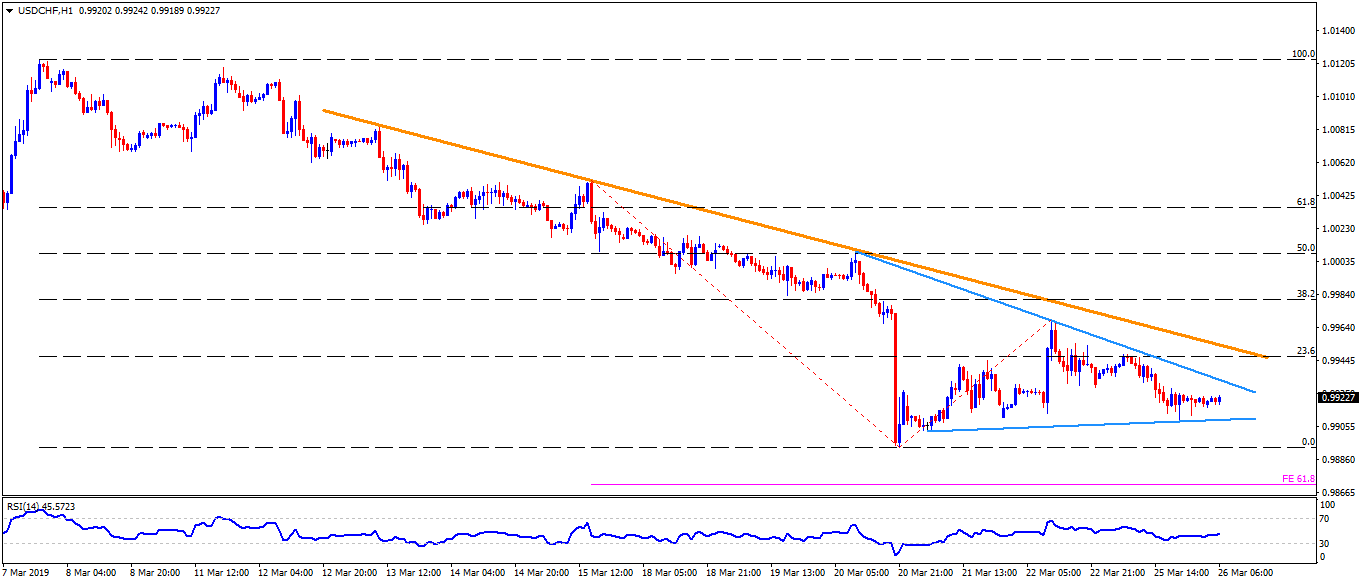
USD/CHF hourly chart
- While a week-long descending trend-line caps immediate advances at 0.9930, a fortnight old downward sloping resistance-line increases the importance of 0.9960 barrier to the north.
- 61.8% Fibonacci expansion (FE) of the quote’s moves since March 15 could offer nearby support at 0.9875.