“¢ Finally breaks through a four-week-old trading range, triggering a short-covering rally beyond parity mark to the highest level since May 17.
“¢ Daily RSI holds comfortably in positive territory but MACD is yet to catch up and hence, bulls might take a brief pause before extending the momentum.
“¢ The bullish trajectory could get extended even beyond one-year tops set in May, towards 61.8% Fibonacci expansion level of the April-May up-swing and subsequent retracement.
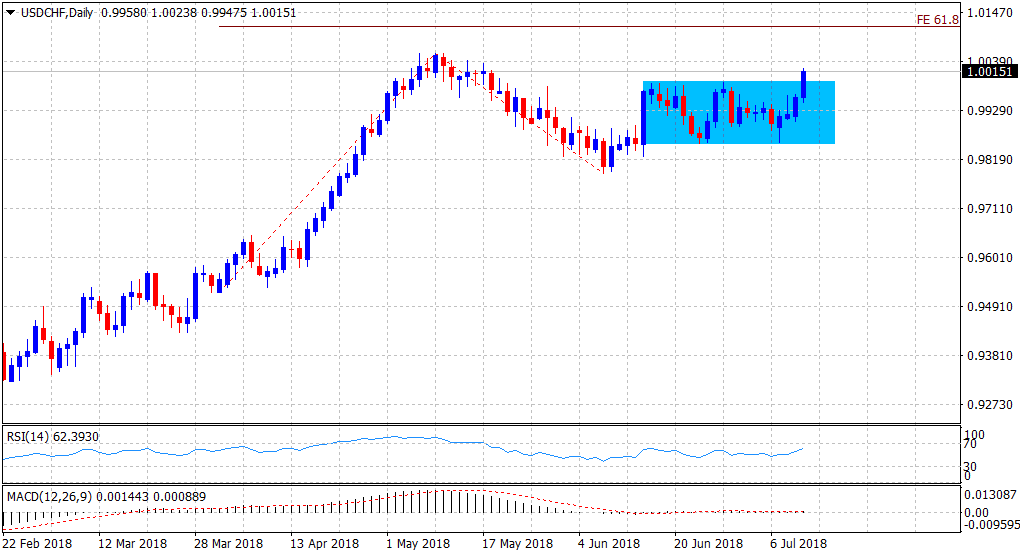
Spot rate: 1.0015
Daily Low: 0.9948
Trend: Bullish
Resistance
R1: 1.0045 (R3 daily pivot-point)
R2: 1.0057 (1-year tops set in May)
R3: 1.0100 (round figure mark)
Support
S1: 0.9990 (trading range resistance break-point)
S2: 0.9944 (50-period SMA H1)
S3: 0.9920 (S1 daily pivot-point)
