- USD/CHF remains below near-term resistance-line forming part of immediate rising wedge bearish formation.
- 200-bar SMA, 50% Fibonacci retracement can question pair’s downside below 0.9857/54 confluence.
USD/CHF fails to extend the latest upward trajectory as it trades near 0.9900 during Asian session on Monday.
While drawing trend-lines with the help of highs and lows marked since August 23, a short-term rising wedge, bearish formation, appears on the four-hour chart. However, the resistance-line can be stretched since early-August levels for further precision.
As a result, 0.9922 acts as a tough upside barrier amid overbought conditions of 14-bar relative strength index (RSI), a break of which can escalate the pair’s rise to July 26 high of 0.9948 ahead of flashing August month top of 0.9968 on buyers’ radar.
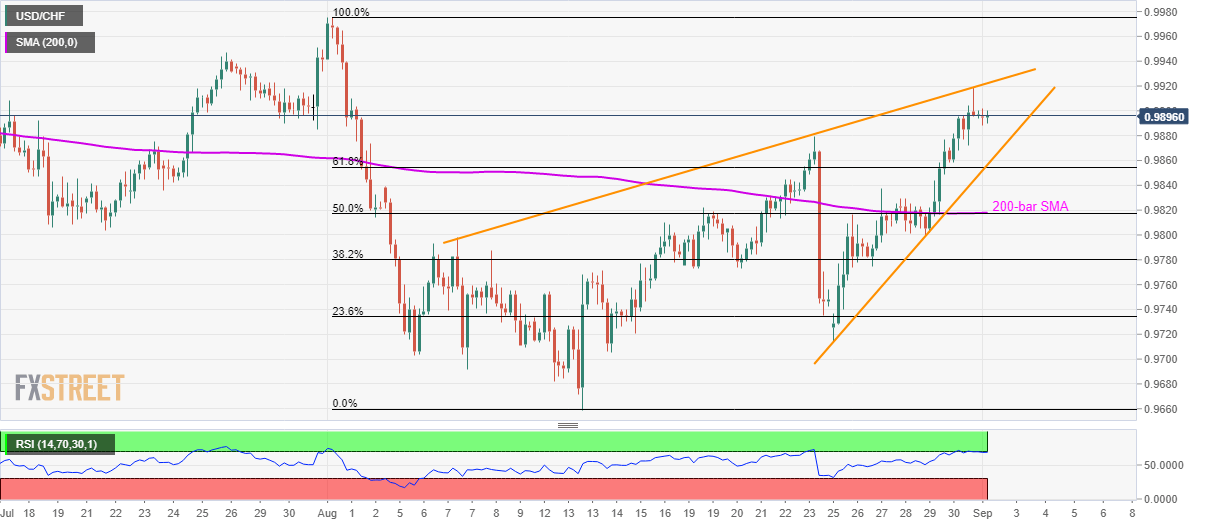
During the pair’s pullback, 61.8% Fibonacci retracement of August month downpour and the formation’s lower-line becomes the key support around 0.9857/54, a break of which can drag the quote to 200-bar simple moving average (SMA) and 50% Fibonacci retracement near 0.9818/17.
In a case, prices keep trading southwards past-0.9817, August 25 low near 0.9717 could be bears’ favorite.
USD/CHF 4-hour chart
Trend: pullback expected
