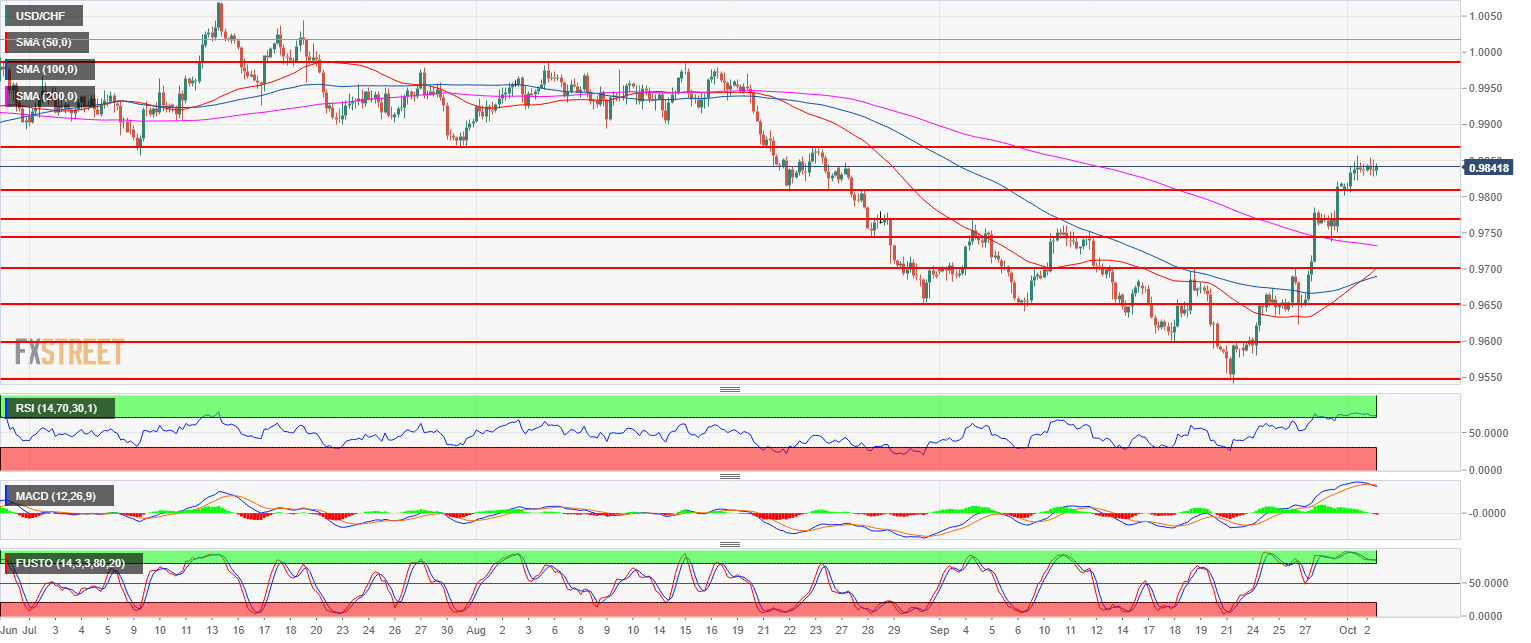
- USD/CHF is in a bull trend but has met significant resistance at 0.9868 July 31 low and near the 100-day simple moving average (not shown).
- USD/CHF broke above the 50, 100 and 200-period simple moving averages (SMA) while the 50 SMA crossed above the 100 SMA, suggesting bullish momentum. The RSI and Stochastics indicators are oversold while the MACD is turning lower.
- All suggesting that the market can pullback down below the 0.9868 resistance towards 0.9820 (August 25 low) and 0.9807 (August 22 low) in the short-term
USD/CHF 4-hour chart
Spot rate: 0.9844
Relative change: 0.03%
High: 0.9854
Low: 0.9828
Main trend: Bullish
Resistance 1: 0.9868 July 31 low
Resistance 2: 0.9984 August 15 high
Resistance 3: 1.0000 parity level
Support 1: 0.9820 August 25 low
Support 2: 0.9807 August 22 low
Support 3: 0.9788 June 7 swing low (key level)
Support 4: 0.9768 September 4 swing high
Support 5: 0.9745-47, August 28 low, 200-day simple moving average
Support 6: 0.9700 figure
