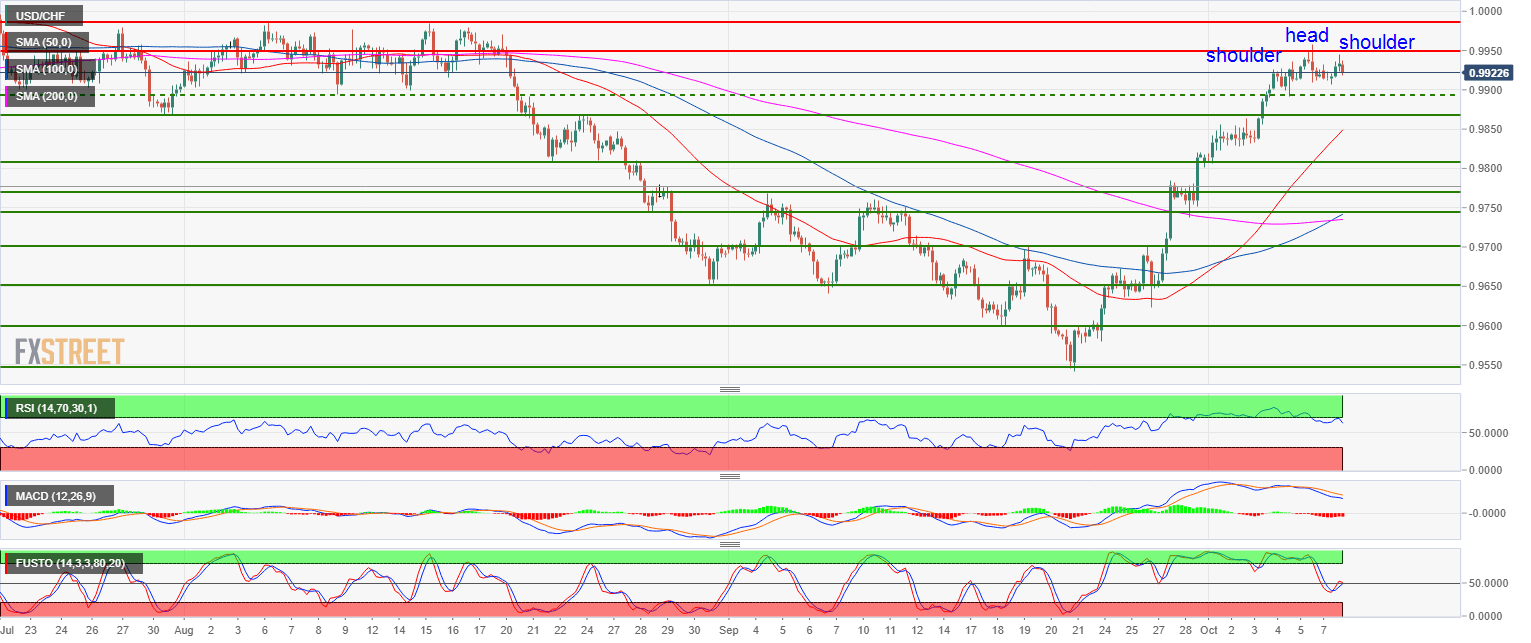
- USD/CHF is trading in a bull trend as the 50 and 100-period simple moving averages (SMA) are moving upward. The 100 SMA crossed above the 200 SMA which is considered a bullish clue known as golden cross.
- However, USD/CHF is currently stalling below the 0.9950 level as the market is forming a small head-and-shoulders pattern which can signal that a pullback can be imminent. The MACD indicator also started decelerating since early October.
- Supports to the downside can be located near 0.9891 October 4 low and 0.9868 July 31 low. A strong bull breakout above 0.9950 should lead to an acceleration to the parity level.
Spot rate: 0.9923
Relative change: 0.04%
High: 0.9945
Low: 0.9906
Main trend: Bullish
Resistance 1: 0.9950 figure
Resistance 2: 1.0000 parity level
Resistance 3: 1.0068 July 13 high
Support 1: 0.9891 October 4 low
Support 2: 0.9868 July 31 low
Support 3: 0.9820 August 25 low
Support 4: 0.9807 August 22 low
Support 5: 0.9788 June 7 swing low (key level)
Support 6: 0.9768 September 4 swing high
