- USD/CNH’s daily chart MACD and candlestick arrangement indicates a bullish reversal.
- The pair looks set to challenge a four-month bearish trendline.
USD/CNH could witness a significant bounce over the next few days.
That’s because the daily chart MACD histogram, a widely-followed technical analysis tool, has crossed above zero, indicating a bearish-to-bullish trend change.
Tuesday’s bullish marubozu candle also indicates the path of least resistance is now on the higher side.
And lastly, the 14-day relative strength index (RSI) has bounced up from below-30 or oversold territory, indicating scope for a corrective bounce.
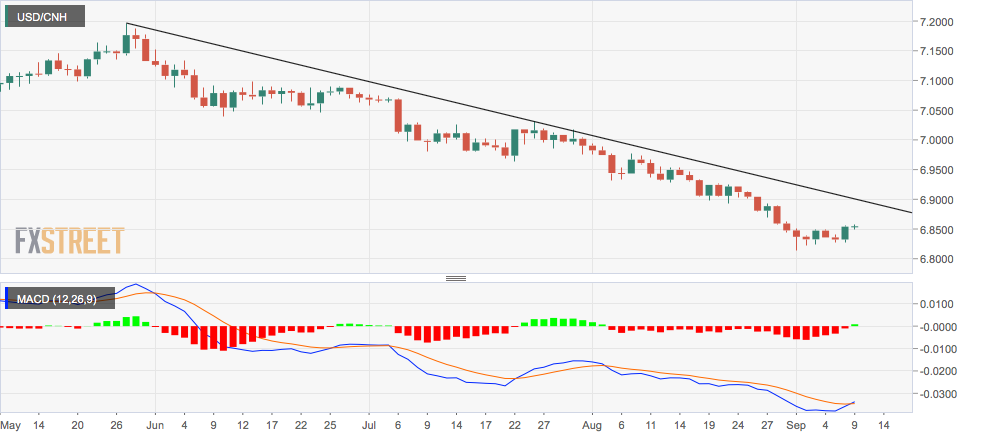
The pair could challenge the trendline falling from May 27 and July 24 highs. The trendline hurdle is currently located at 6.90, and the pair is trading near 6.85.
Daily chart
Trend: Bullish
Technical levels
