- USD/CNH takes the bids towards the immediate resistance confluence.
- The two-week-old falling trend line and 61.8% Fibonacci retracement of December 2019 to January 20 declines, followed by 100-day SMA, challenge buyers.
- Sustained trading below 50% Fibonacci retracement could recall early-January lows.
USD/CNH rises to 6.9900 amid the initial Chinese session on Tuesday. The pair recently reversed from three-day low while targeting ton confront the near-term key resistance confluence during further recovery.
Not only 6.9950/60 but a 100-day SMA level of 7.0110 and the monthly top surrounding 7.0230 will also question the buyer during any further upside.
On the downside, the pair’s sustained trading below 50% Fibonacci retracement level of 6.9665 could drag the quote to January 02 lows near 6.9565.
During the pair’s declines below 6.9565, 38.2% and 23.6% Fibonacci retracements, around 6.9380 and 6.9030 can please the bears.
USD/CNH daily chart
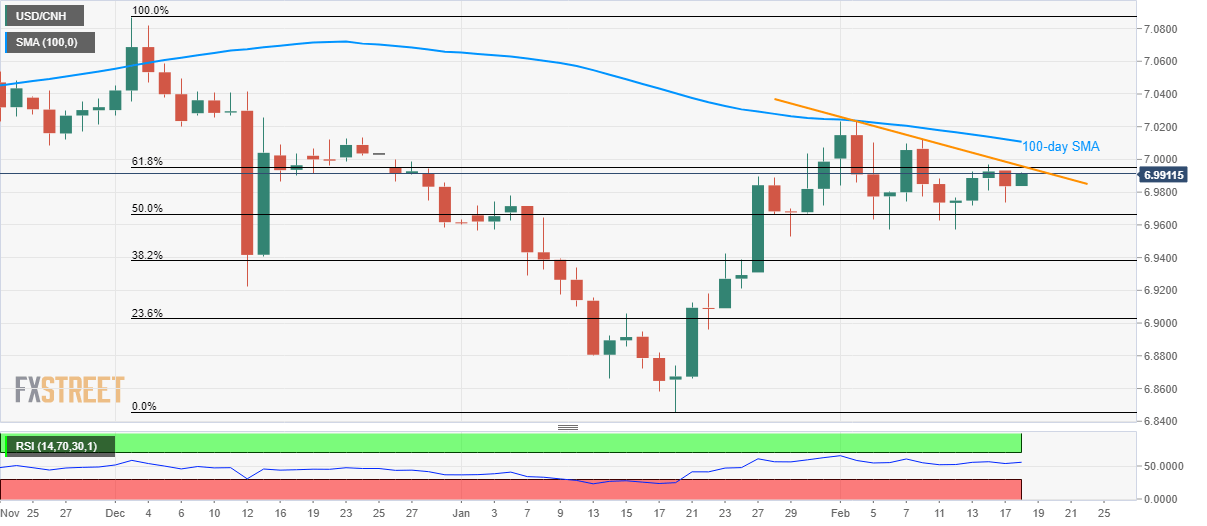
Trend: Pullback expected
