- USD/CNH sellers attack a two-week-old support line amid bearish MACD.
- Downside break of triangle holds the key to monthly low.
- Bulls will look for entry beyond 6.8610, 100-bar SMA offers extra resistance.
USD/CNH fails to extend the downside break of a fortnight-long symmetrical triangle while bouncing off 6.8257 to 6.8300 during early Monday. Even so, the pair’s recovery moves are likely to languish amid bearish MACD signals.
As a result, sellers remain hopeful and may increase positions once the quote confirms the triangle break, by sustained trading below 6.8275.
In doing so, the monthly low, also the lowest since May 2019, near 6.8130 will be on their radar ahead of 6.8000 psychological magnet.
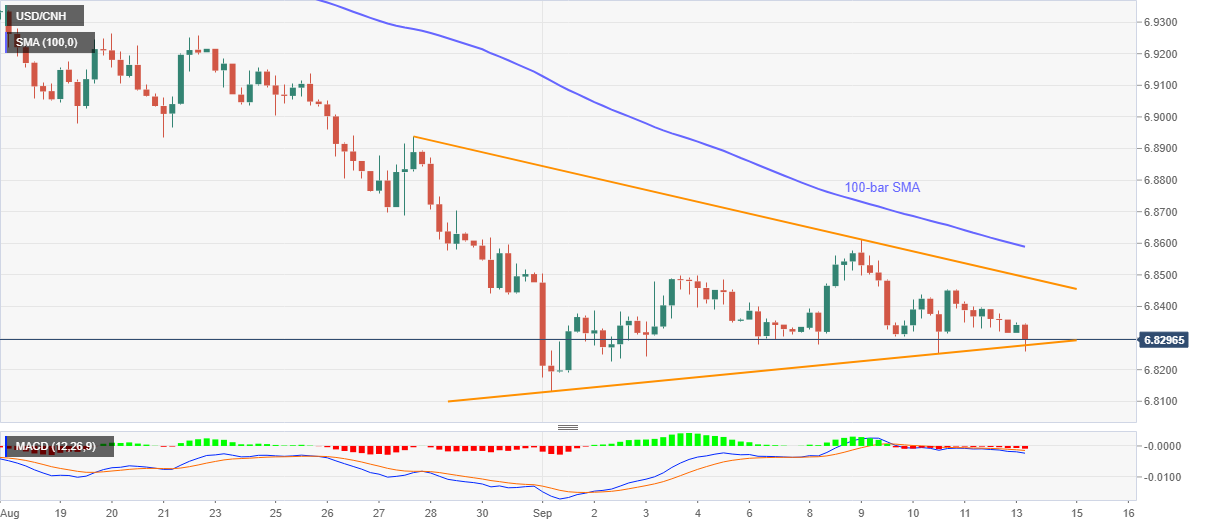
Alternatively, the pair’s upside break of the mentioned triangle resistance, at 6.8493 now, will need a successful break of 100-bar SMA, currently around 6.8590, to challenge the monthly peak close to 6.8610.
If at all the bulls remain dominant past-6.8610, the August 27 high of 6.8936 could lure them during the further upside.
USD/CNH four-hour chart
Trend: Sideways
