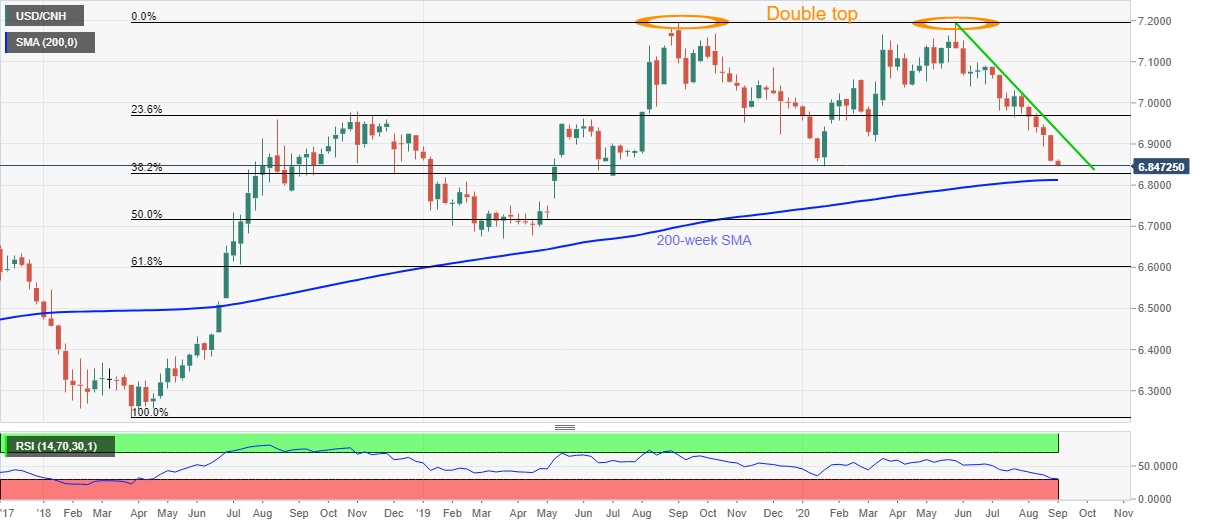
- USD/CNH confirms double top bearish technical formation while declining below January’s low of 6.8456.
- Oversold RSI, 200-week SMA questions the pair’s further selling.
- A three-month-old falling trend line restricts recovery moves.
- Better than forecast China PMIs pleases the bears.
USD/CNH refreshes the yearly low to 6.8447, currently around 6.8478, during the early Monday’s trading. The cross-currency pair extends Friday’s losses to confirm the bearish chart pattern, namely “double top”, after China’s monthly official PMIs fared better than downbeat forecasts in August. Though, this week’s closing will be the key as a downside break below January’s bottom of 6.8456 can drive the prices further towards the south.
Read: Chinese Composite PMIs arrive at 54.5 in expansion territory
The sellers are currently targeting 38.2% Fibonacci retracement level of the quote’s upside from March 2018 to May 2020, at 6.8288.
However, oversold RSI conditions may join the 200-week SMA to challenge the pair’s additional downturn past-6.8125.
Meanwhile, a weekly closing beyond 6.8456 may attempt recovery moves towards the 6.9000 threshold while a downward sloping trend line from late-May, at 6.9310 now, can challenge the bulls afterward.
In a case where the USD/CNH prices rally past-6.9310, the 7.000 psychological magnet will be in the spotlight.
USD/CNH weekly chart
Trend: Pullback expected
