- USD/CNH stays pressured, refreshes intraday low, inside bearish chart pattern.
- 200-HMA can test downside as RSI inches closer to oversold territory.
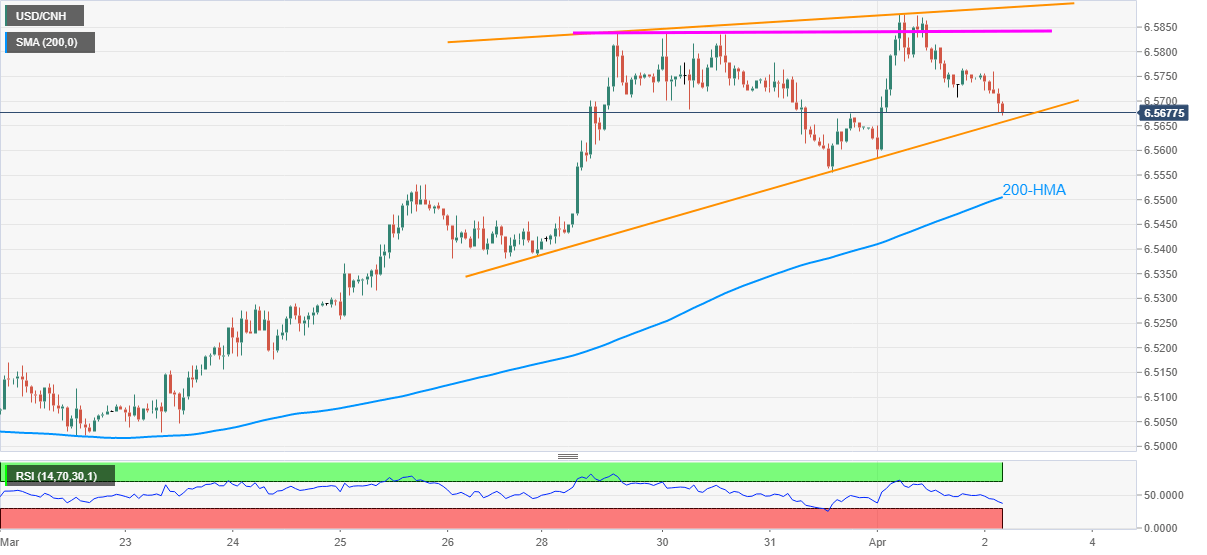
USD/CNH stands on a slippery ground while picking the offers around 6.5675 during early Friday. In doing so, the pair remains depressed inside a rising wedge bearish formation near the highest levels since late November.
Given the descending RSI line and sellers-supportive chart pattern near the multi-day top, USD/CNH is likely to confirm the bearish play by breaking the immediate support line of 6.5655.
While a clear break of 6.5655 should theoretically call 6.5100 area, 200-HMA around 6.5500 may challenge the pair’s downside amid likely oversold RSI by then.
Meanwhile, the corrective pullback can eye 6.5760 but the weekly horizontal line around 6.5840 and the stated pattern’s resistance line around 6.5900 will be tough nuts to crack for USD/CNH buyers.
Overall, USD/CNH is ready for consolidating the latest gains but the key HMA can check the bearish moves.
USD/CNH hourly chart
Trend: Further weakness expected
