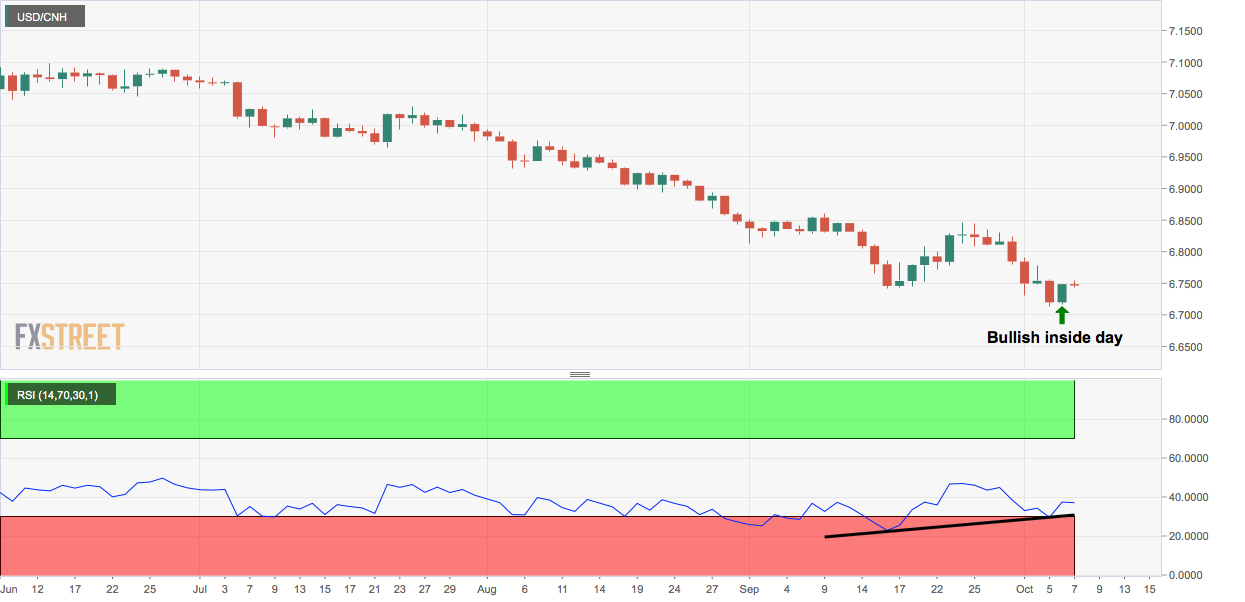
- USD/CNH created a bullish inside day candle on Tuesday.
- Key daily chart indicator shows a bullish divergence.
According to USD/CNH’s daily chart, the path of least resistance is now on the higher side.
On Tuesday, the pair formed an inside day candlestick pattern at 17-month lows. That candle is widely considered a warning of an impending bearish-to-bullish trend change.
Further, Tuesday’s gain confirmed a bullish divergence of the 14-day relative strength index.
As such, the trendline falling from May 27 and July 24 highs could come into play. At press time, the trendline hurdle is located at 6.83, and the pair is trading at 6.74.
The bias would again turn bearish if the pair finds acceptance under Tuesday’s low of 6.7164.
Daily chart
Trend: Bullish
Technical levels
