- USD/CNH struggles to extend bounce off 50% Fibonacci retracement.
- Successful upside beyond near-term key resistance-confluence can challenge 7.14 horizontal-line.
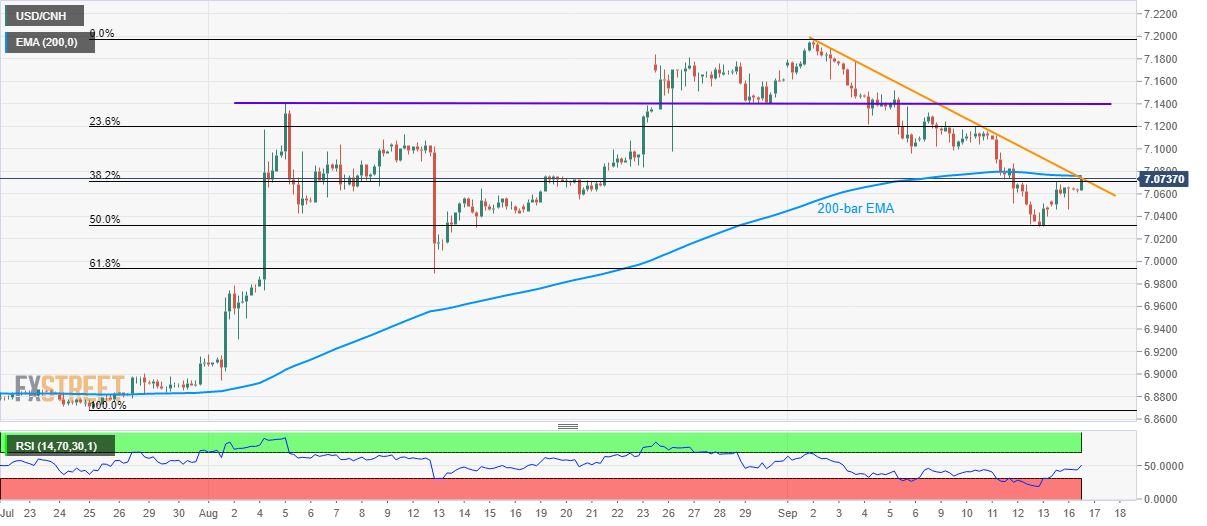
The USD/CNH pair’s U-turn from 50% Fibonacci retracement level struggles to clear near-term key resistance-confluence as it trades near 7.0740 during early Tuesday.
The quote needs a successful break above 7.0740/60 region comprising 200-bar exponential moving average (EMA) and a two-week-old falling trend-line in order to justify its recent recovery.
In doing so, buyers can target a horizontal-line surrounding 7.1400 that includes August-05 high and August 29/30 lows.
If at all bulls manage to dominate past-7.1400, monthly high surrounding 7.1970 and 7.2000 will be on their radar.
On the downside, pair’s declines below 50% Fibonacci retracement of July-September rise, at 7.0324, can recall sellers aiming for 7.000 round-figure.
Further, pair’s sustained south-run under 7.000 enables them to question August month low near 6.8940 ahead of revisiting late-July bottom close to 6.8680.
USD/CNH 4-hour chart
Trend: pullback expected
