- A bounce from 200-DMA enables USD/CNH buyers to aim for a month-old support-turned upside hurdle.
- 21-DMA can welcome the bulls past-breakout whereas 61.8% Fibo. acts as nearby support.
Having reversed from the 200-day simple moving average (SMA), the USD/CNH pair is aiming for the four-week-old horizontal resistance (previous support) as it trades near 6.8850 during the early Asian session on Wednesday.
A successful break of 6.8870/83 support-turned-resistance area can propel the pair towards 21-DMA level of 6.9142 whereas 6.9400 may question the quote’s further upside.
In a case, prices rally past-6.9400, current month high around 6.9626 and November 2018 top surrounding 6.9810 can please the bulls.
Meanwhile, 61.8% Fibonacci retracement of November 2018 to March 2019 declines, at 6.8618, seems adjacent rest for the pair ahead of dragging it to 200-DMA level of 6.8365.
USD/CNH daily chart
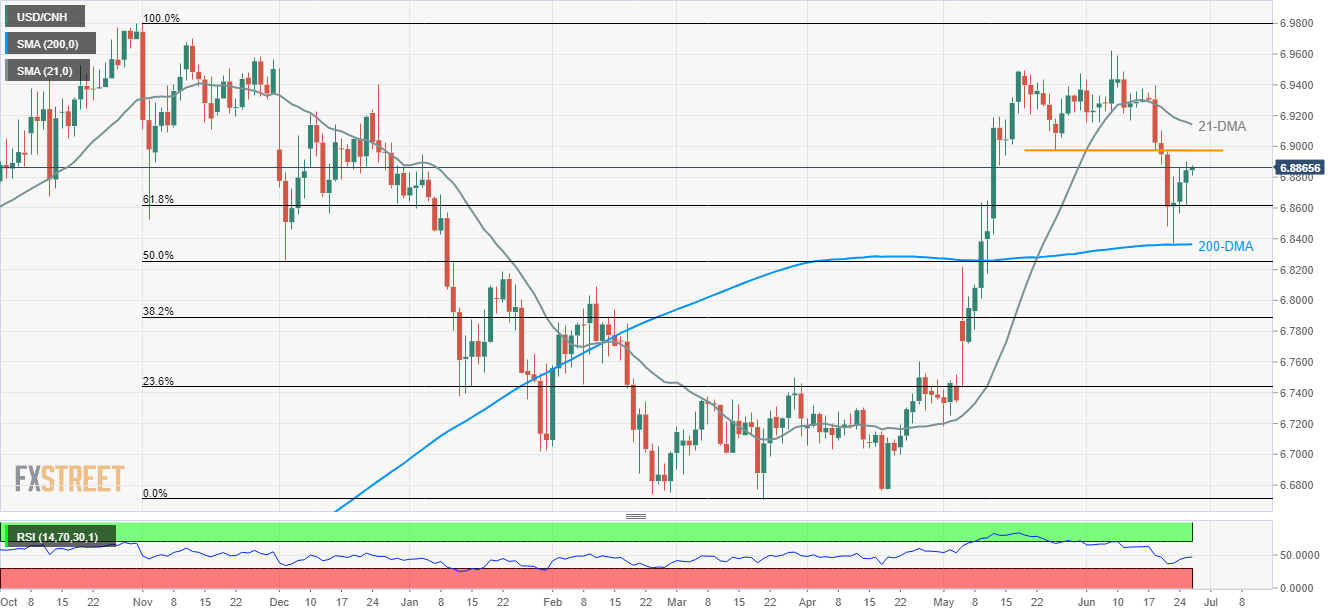
Trend: Bullish
