- USD/CNH trades in a range below the key short-term moving average.
- Technical indicators show traders’ indecision.
USD/CNH keeps following a short-term symmetrical triangle as it trades near 6.8755 during early Friday.
The pair recently bounced off the pattern support, indicating brighter chances of its pullback towards yesterday’s high around 6.8867. However, 200-bar moving average on 4-hour chart, coupled with the formation resistance, could limit the pair’s further upside around 6.8946/52.
While 14-bar relative strength index (RSI) and 12-bar moving average convergence/divergence (MACD) are both signaling traders’ indecision, pair’s rise past-6.8952 could recall buyers targeting June 19 high around 6.9100.
On the downside, 38.2% Fibonacci retracement of June month declines and the triangle support can limit the quote’s south-run near 6.8710/20.
It should also be noted that the pair’s declines beneath 6.8710 can push bears towards 23.6% Fibonacci retracement level of 6.8500 ahead of highlighting late-June low close to 6.8166.
USD/CNH 4-hour chart
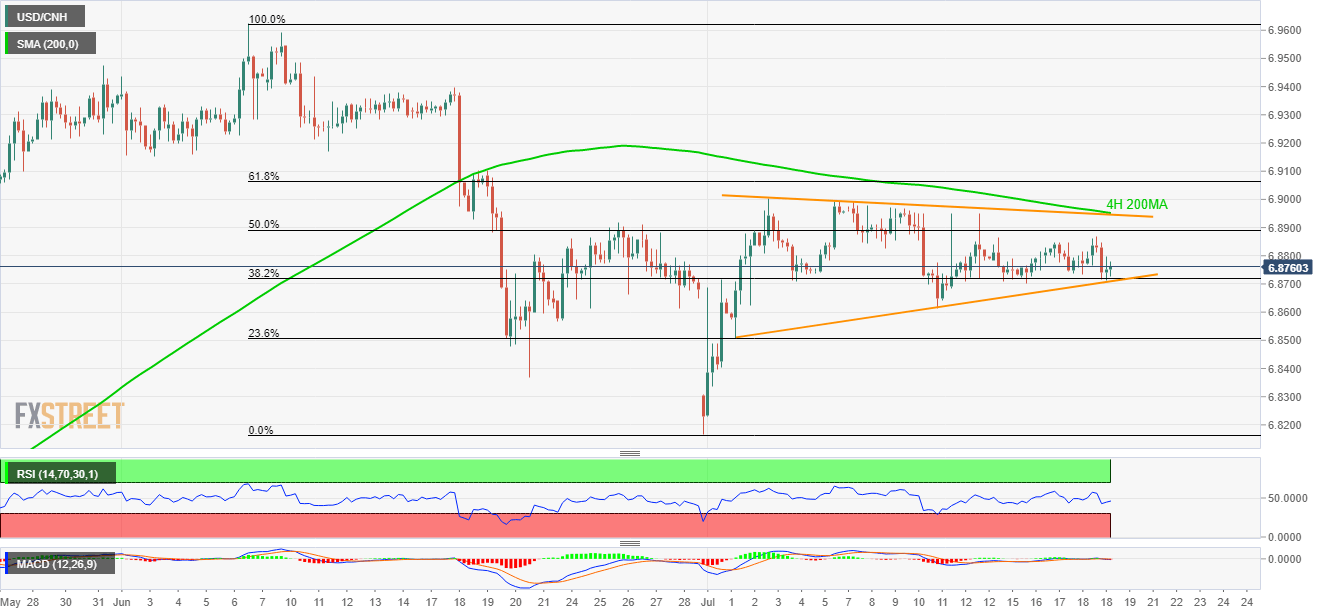
Trend: Sideways
