- USD/CNH clocks 4.5-month highs.
- RSI is reporting overbought conditions with the highest print in 10 months.
- Overbought signals would gain credence once signs of bullish exhaustion emerge on the price chart.
The offshore Yuan (CNH) is taking a beating for the fifth straight day amid heightened US-China trade tensions and risk aversion.
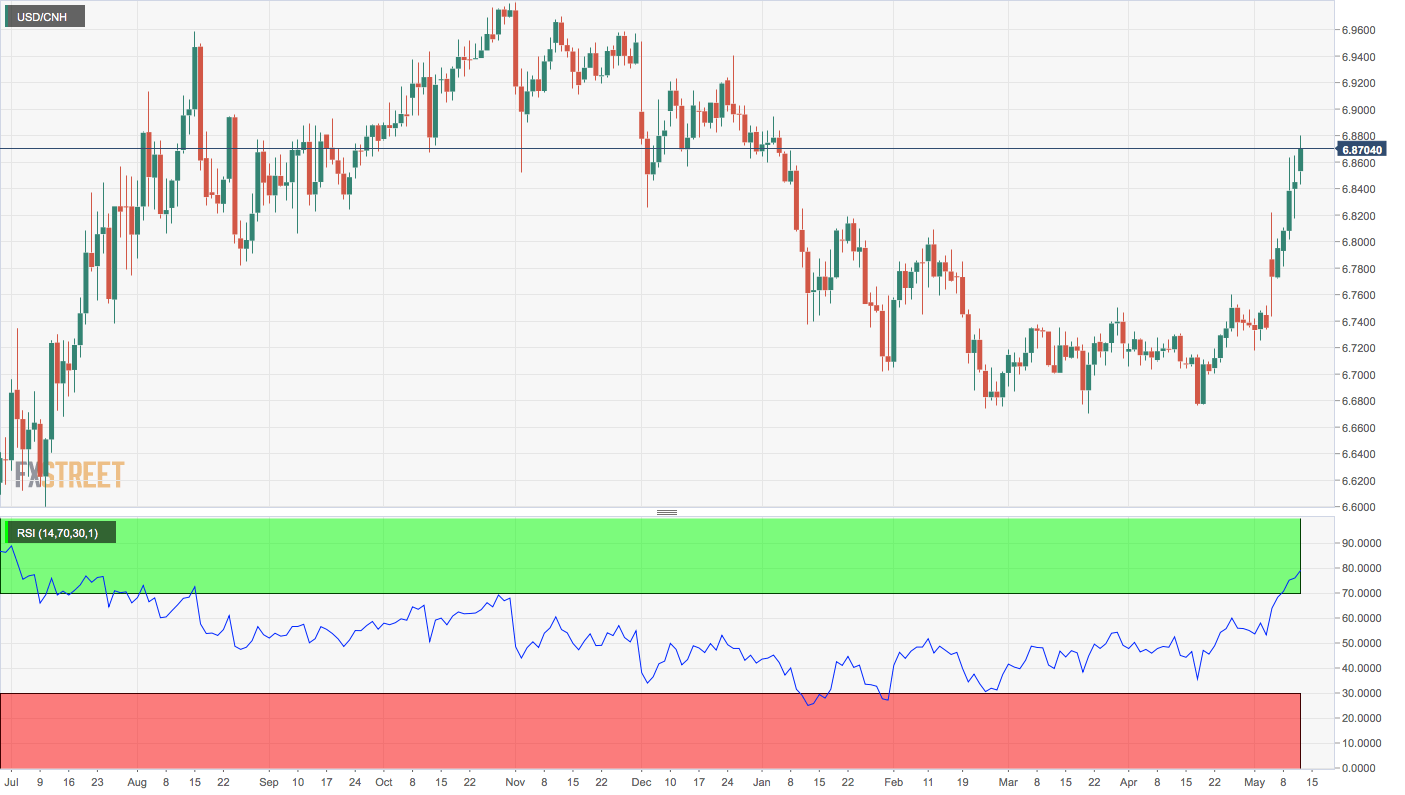
USD/CNH rose to 6.8795 a few minutes before press time, the highest level since Jan 3, and is currently trading at 6.8708, representing 0.41% gains on the day.
The currency pair is looking overbought as per the 14-day relative strength index (RSI), which is currently seen at 78.12, the highest level since July 2018.
These overbought readings, however, would gain credence if and when the pair starts showing signs of bullish exhaustion. It is worth noting that the indicator can stay overbought far longer in a strong trending market than the sellers can remain solvent.
Put simply, the outlook remains bullish and the pair could challenge resistance at 6.9242 (December high) on trade tensions. A close below the 10-day moving average (MA), currently at 6.7868 would abort the bullish view.
Daily chart
Trend: Bullish
Pivot points
