- The USD/CNH pair’s recent recovery forms rising wedge on the hourly chart.
- A downside break of 7.0800 will confirm the bearish technical pattern.
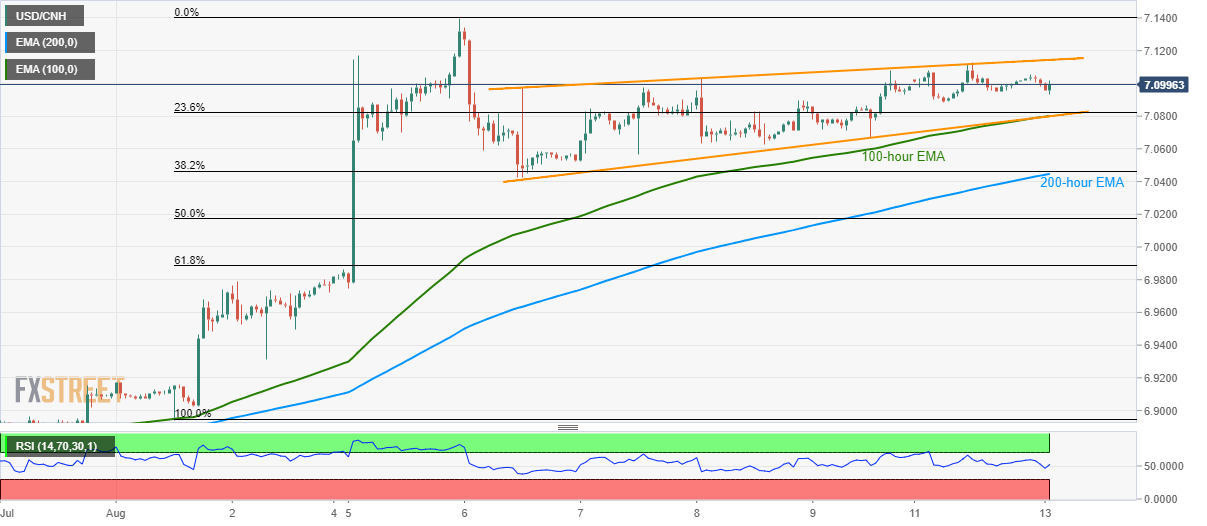
- 200-hour EMA, 38.2% Fibonacci retracement can please sellers during the breakdown.
USD/CNH portrays a bearish technical pattern on the hourly chart while taking rounds to 7.0960 during the early Asian session on Tuesday.
The rising wedge formation gets confirmed on the pair’s break of 7.0800 support-line, also including the 100-hour exponential moving average (EMA), which in-turn can drag the quote to 7.04 – 7.0000 support confluence including 200-hour EMA and 38.2% Fibonacci retracement of current month upside.
During the pair’s further declines below 7.0000, 61.8% Fibonacci retracement level of 6.9880 and 6.9000 may gain bears’ attention.
On the upside break of 7.1144, the bearish pattern gets negated and can further propel prices to latest high near 7.14000.
USD/CNH hourly chart
Trend: Pullback expected
