USD/CNH has again created a long-tailed weekly candle – a sign of seller exhaustion near 6.67.
The pair, therefore, may find acceptance above the key 50-day MA hurdle next week. That move could pave the way for a rally to the double bottom neckline resistance of 6.75.
As of writing, the spot is trading at 6.7028, down 0.08 percent on the day, and the 50-day moving average is seen at 6.7206.
Weekly chart
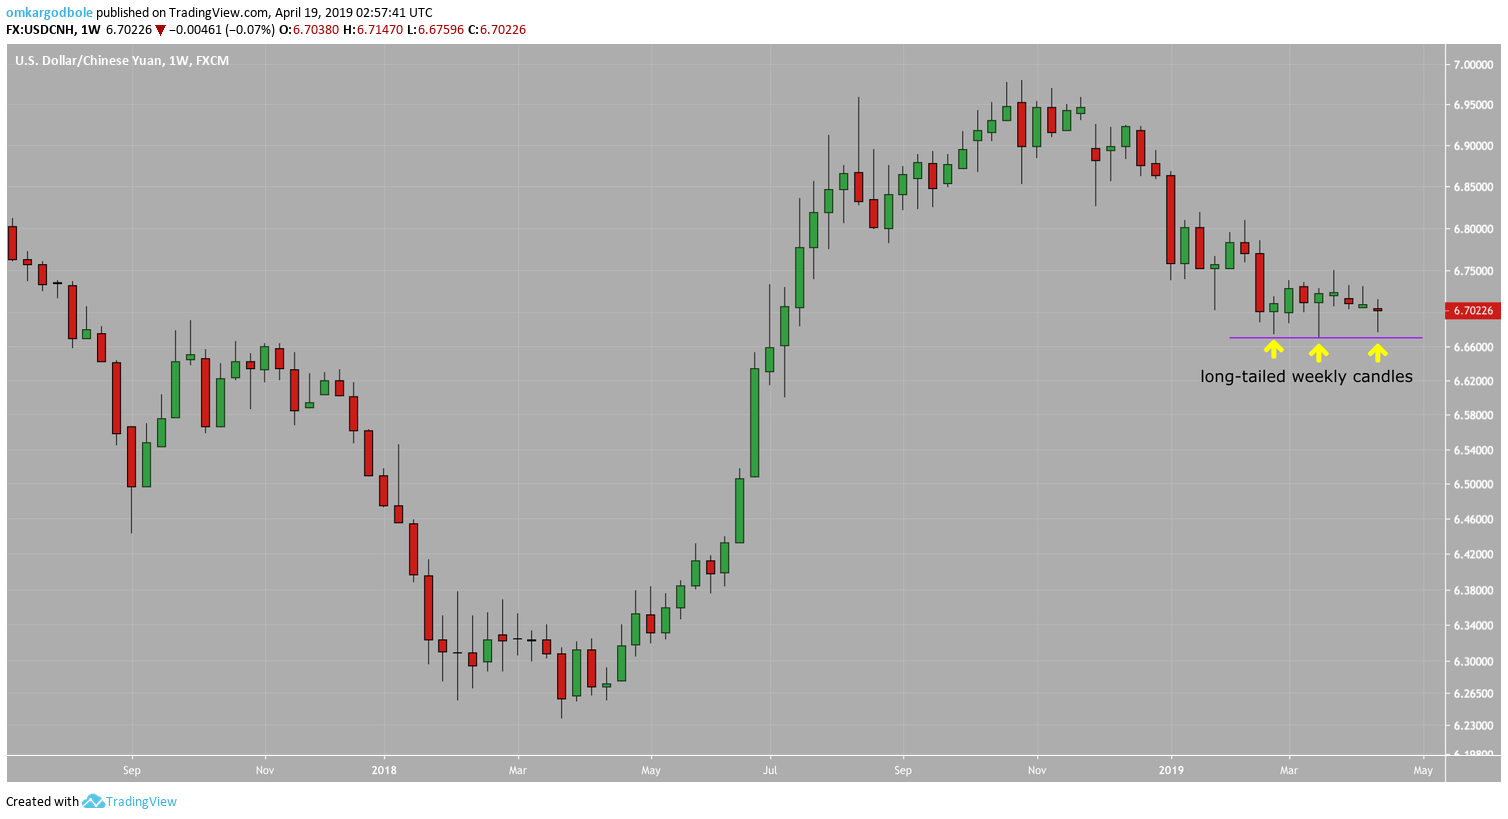
- As seen above, the pair has created a long-tailed doji this week, the third in eight weeks.
- Notably, the three long-tailed candles have printed lows near 6.67, a sign of bearish exhaustion.
- As a result, the spot could see a corrective bounce next week, more so, if the long-held 50-day MA resistance is breached.
Daily chart
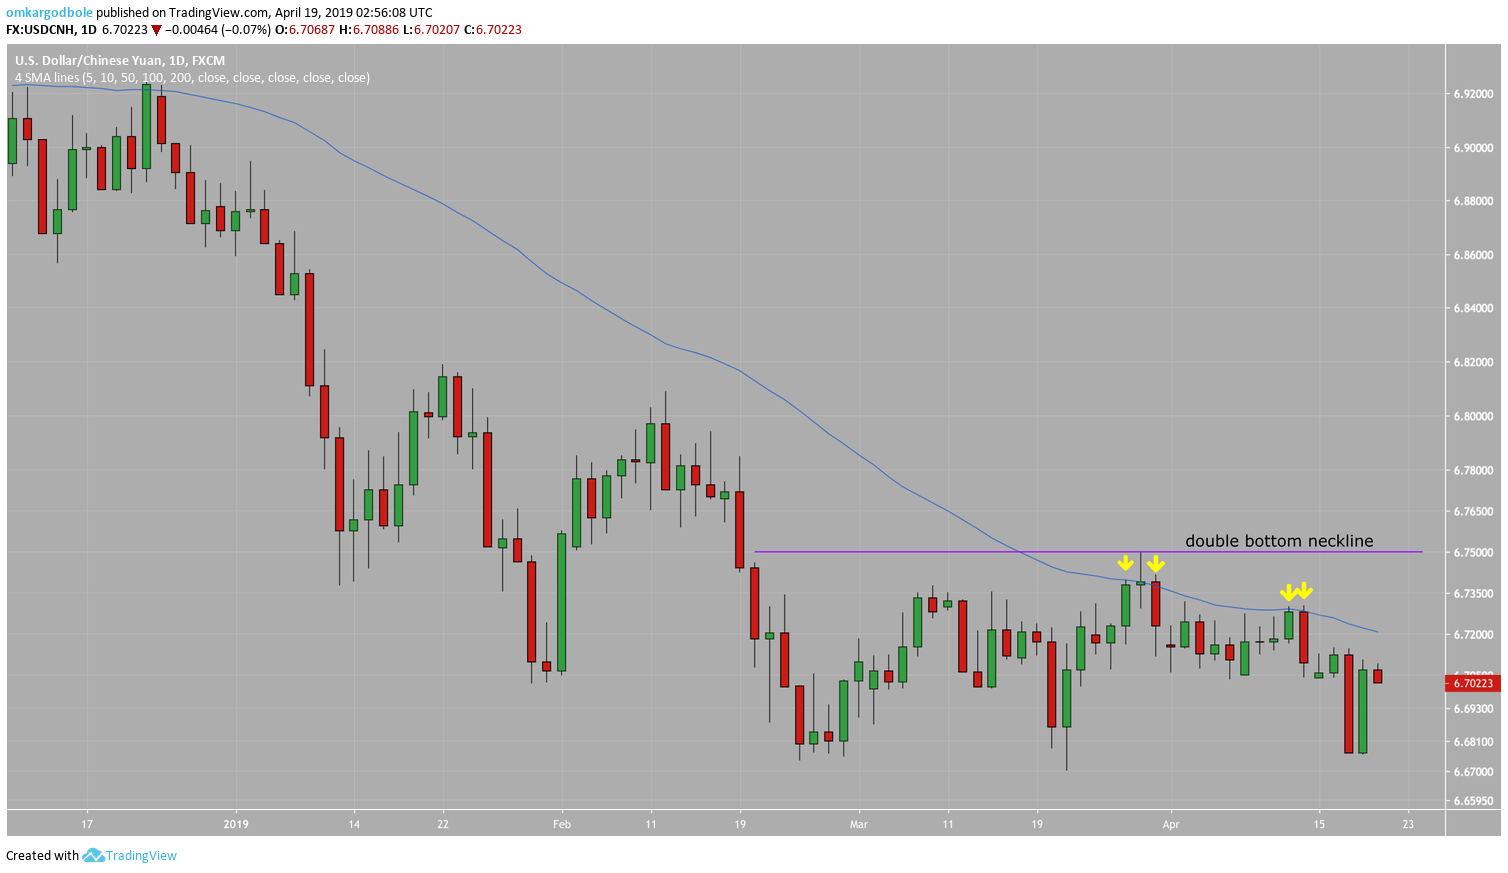
- As seen above, the 50-day MA has capped upside at least four times in the last three weeks.
- Hence, acceptance above that key MA hurdle, currently at 6.7206, would validate the long-tailed candles seen on the weekly chart and open the doors to 6.7292 (double bottom neckline).
- The bullish case, however, would weaken if the spot finds acceptance below 6.67.
Trend: Cautiously bullish
